

Powering Growth by Future-Proofing the Frontline
At the Adani Group, as we fuel our ambitious expansion plans, we are shifting from conventional HR management processes to a data-driven, execution-led growth model. Our people philosophy is grounded in continuous learning and progressive policies, enabling a supportive and inclusive ecosystem where innovation and employees thrive. By integrating AI and analytics, we align the workforce with business imperatives and personalise career trajectories, paving the way for a high-performance culture.
Key Linkages
Material Topics
Strategic Priorities
Key Risks and Opportunities
Capitals Impacted
 Human Capital
 Social & Relationship Capital
SDGs



Our people philosophy is grounded in continuous learning and progressive policies, enabling a supportive and inclusive ecosystem where innovation and employees thrive.

People Philosophy and Strategic Human Capital Framework
To nurture a future-ready, Adani values- driven workforce on the foundations of safety, inclusivity and, empowerment—where continuous learning, technical upskilling, leadership development and technology-led transformation enable our people to become self-reliant, Saksham, and confident contributors to nation building, steadily progressing in culture of trust, care, transparency and well-being. This vision is underpinned by our commitment to equity and inclusion, ensuring accessible workplaces, equal opportunity and a sense of belonging for all.
To attract, develop and retain diverse talent and make them future-ready by strengthening technical and leadership capabilities, enabling technology-led transformation, promoting safety, wellness and employee care, ensuring equity and inclusion across accessible workplaces, and nurturing open communication—so that while realising their full potential, our people are empowered, resilient and, aligned to long-term value creation and contribute to our shared purpose of nation-building.
The Adani Group’s People Strategy
At the Adani Group, our people strategy is centered on building a future-ready, inclusive and responsible workforce. By strengthening skills, leadership and digital capabilities, upholding human rights, and enabling equitable opportunities and fair practices, we empower our people to thrive.
Strengthening early career talent acquisition and structured leadership development to build a future-ready talent pipeline.
Investing in upskilling and livelihood generation, aligned with business growth and national skilling priorities.
Enhanced structural accessibility across the Adani Corporate House and 100% compliance with the RPwD Act, 2016, promoting dignity and inclusion for persons with disabilities.
Leveraging data, dashboards, and HR technology aligned with global annual-reporting guidance to enable performance insights and decision making.

Lean structures enabling broader roles, merit based growth and faster, higher quality decision making.
Enhancing living standards, safety and compliance through industry leading welfare initiatives, particularly at the remote sites.
Holistic wellness framework integrating preventive, digital, and community based healthcare.
Promoter driven employee communication and engagement practices, promoting transparency, leadership accessibility, and strong employee connection.
Our Employee Value Proposition (EVP)
At the Adani Group, we offer purpose driven careers at the forefront of nation building. The Group operates across diverse large scale, mission critical infrastructure domains spanning energy, green hydrogen, data centers, manufacturing, transport, logistics, utilities, resources and next generation infrastructure. This unmatched scale of operations, complexity of businesses, and high-growth platforms create opportunities rarely available at comparable scale elsewhere.
The EVP is closely aligned with the evolving needs of infrastructure and energy development, enabling employees to build future-relevant capabilities. This drives long-term sustainable growth, preparing talent not only for today, but for emerging business and next generation leadership roles.
Purpose Driven / Scaled Impact / Future-Ready
Purpose
Nation building through infrastructure leadership
Scale
Large, complex, mission-critical platforms
Ownership
Early Accountability and merit-based progression
Mobility
Cross-business career pathways
Culture
Entrepreneurial, performance driven, high impact
Philosophy
Growth with Goodness
Unmatched Scale with National Impact
Unmatched opportunities to contribute to projects shaping India’s long term economic and sustainability agenda
Capability Through Complexity
Exposure to multi-stakeholder, high-responsibility environments, and large integrated value chains, accelerating employees’ technical, commercial and leadership capabilities
Future-Focussed High Growth Platforms
Participation in business creation, scale-up and transformation through exposure to high growth and future facing
Early Ownership and Leadership Opportunities
Career progression driven by outcomes, impact and capability, rather than tenure or hierarchy
Cross Business Mobility and Limitless Exposure
Diverse career paths across varied domains within a single ecosystem, accelerating learning, adaptability and leadership readiness
Value-Led Growth
Growth guided by core values - Courage, Trust and Commitment, and rooted in the Growth with Goodness philosophy, which balances scale and performance with responsibility, safety, inclusion and sustainability
AI, Advanced Analytics and Digital Transformation
Providing employees with exposure to:
- Enterprise-scale AI and analytics
- Smart Infrastructure and integrated digital platforms
- Capability building aligned to digital skills and evolving business models
Sustainability and Climate Aligned Capabilities
Positioning employees for future economy through:
- Participation in Renewable energy, green hydrogen and energy transition initiatives
- Climate-aligned infrastructure development
- Responsible resource management and ESG-led decision-making
- Capability enhancement in green skills, sustainability leadership and climate conscious business acumen
Future Leadership & Adaptive Skills
Fostering employee adaptability and leadership readiness through:
- Exposure to complex, multi-stakeholder environments
- Cross-business and cross-sector mobility
- Leadership roles that require speed, judgment and accountability
Leadership, Culture and Ways of Working
At the Adani Group, leadership, culture and ways of working are shaped by strong governance and entrepreneurial culture that enables speed, scale and responsible execution. Clear governance frameworks, defined decision rights and Board oversight ensure alignment with strategy, execution and long-term value creation. Our leadership culture is rooted in the values of Courage, Trust and Commitment that guides leaders to demonstrate ownership, integrity and accountability.

- Clear Delegation of Authorities (DOA)
- Defined decision rights, accountability and escalation frameworks
- Board oversight and governance frameworks
- Accountability not only on business outcomes but on effectiveness of ethical conduct, people stewardship, safety and inclusion
- ABEC framework for employees (behaviours and competencies)
- Cross-functional and cross business collaboration
- Entrepreneurial, execution-driven mindset
- Adjacency-led business model enables cross-entities collaboration
- Shared platforms for knowledge sharing, joint planning and integrated decision-making
- Experimentation and learning through execution and continuous improvement
- Codes of conduct and governance standards
- Strong emphasis on people stewardship, psychological safety, overall wellbeing, human rights, inclusion and respect
- Encouragement to open dialogue, constructive challenge and respectful dissent
- Grievance and whistleblowing mechanisms
- Responsible stakeholder engagement
Change Management: A People-Led Journey
In a rapidly evolving global business landscape with shifting workforce expectations, the Adani Group embeds change management as a core leadership and people capability. This approach enables workforce agility, future-ready skills and organisational resilience to support long-term sustainable growth.
- Reskilling and upskilling for digital fluency, ESG consciousness and future roles
- Agile workforce models enabling faster decisions making
- Leadership pipeline strengthened to manage complexity and multigenerational teams
- Structured learning journeys
- Internal talent mobility
- Exposure to next-generation leadership challenges
- Drive agility, accountability, innovation and resilience
- Leadership communication and role modelling to institutionalise adaptability
- Employee engagement and change adoption indicators
- Leadership capability assessments
- Talent readiness metrics for critical and future roles
- Course correction and continuous improvement
- Resilient, skilled and future-ready workforce
- Organisational agility to navigate disruption
8,127
Total workforce
▼15% from the previous year
28
Women New Hires
▼10% from the previous year
359
Women in workforce
▼28% from the previous year
43.5
Average hours per FTE of training and development
▲69% from the previous year
770
New Hires
▲84% from the previous year
9.9
Human Return on Investment


Preparing for The Future
Organisational Effectiveness
Organisational effectiveness at Adani Energy Solutions is shaped by strong leadership & governance, integrated strategy planning, operational excellence, people & culture, technology & innovation and proactive stakeholder engagement. Together, these pillars strengthen our accountability, performance and our ability to deliver infrastructure outcomes efficiently, reliably and sustainably.
Initiatives Strengthening Organisational Effectiveness
Process Optimisation Programmes
Streamlining workflows for maintenance, outage response, and system upgrades through digitisation and automation to optimise costs and reliability and achieve business excellence.
Performance Management Systems
Establishing key performance indicators (KPIs) to enhance network reliability, safety, and customer service, supported by regular reviews and targeted improvements.
Change Management
Supporting organisational transformation and digitalisation through structured change management strategies.
Safety and Compliance Campaigns
Driving regulatory adherence and a strong safety culture through training and awareness.
Accelerating Project Life Cycle
Leveraging predictive analytics, drone-based inspections, and advanced grid monitoring to strengthen governance & monitoring and drive continuous improvement across projects in different lifecycle stages.
HR Governance Mode
At the Adani Group, a centralised HR governance framework with decentralised execution ensures consistency in HR policies, standards, and regulatory compliance across the Group. This model reinforces a unified organisational culture and empowers individual businesses with the flexibility at the operating level.
Overarching Guidance
- HR policies, frameworks and standards
Decentralised Execution
- Local workforce management and implementation
Consistent People Practices
Scalable Growth
Cohesive Group Culture
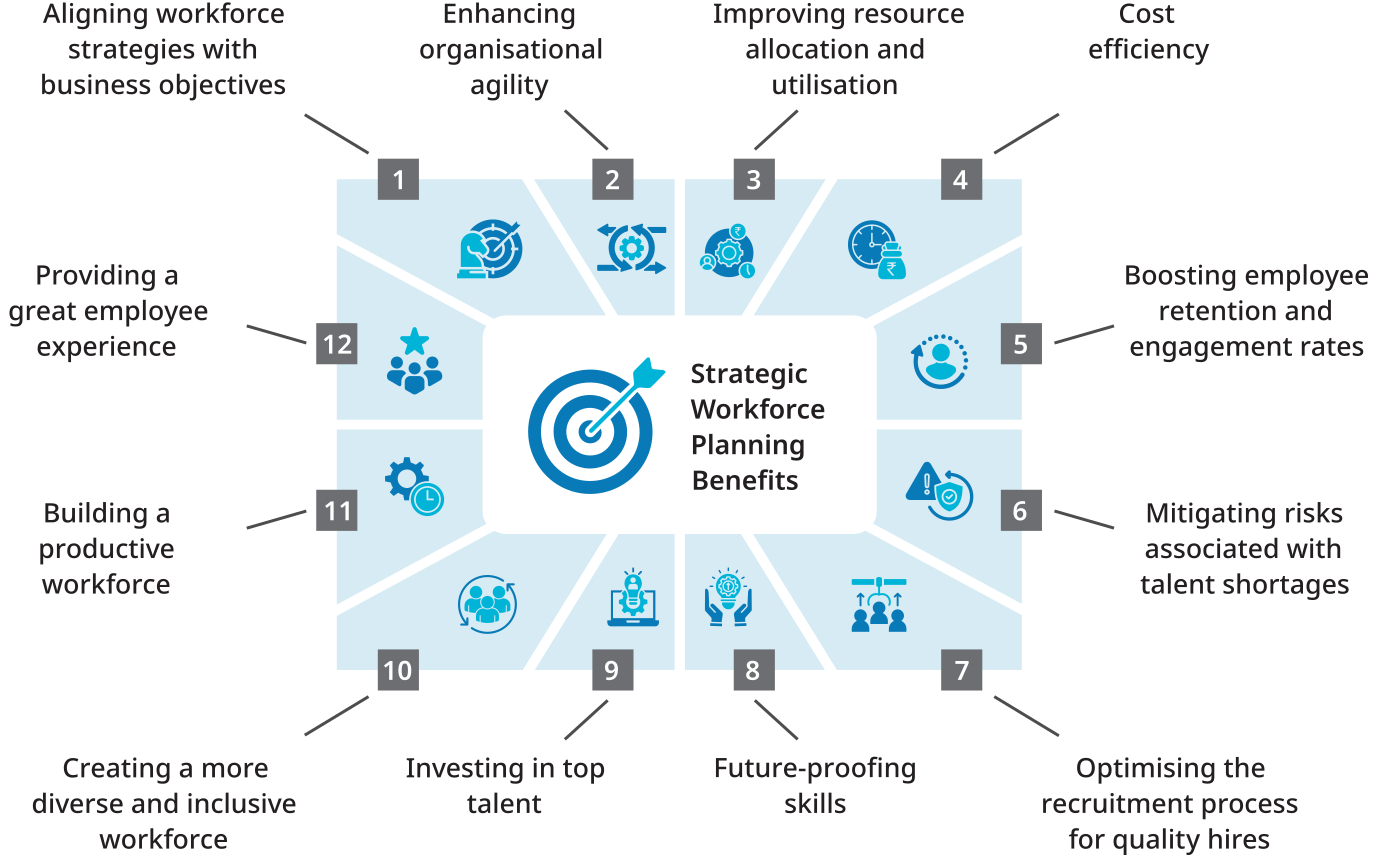
Strategic Workforce Planning & Talent Acquisition
Currently, we operate with a three-layer organisational structure. As we scale and diversify, we are evaluating work models beyond the third layer to enhance capability, agility and decision-making efficiency to support our long-term goals. The objective is to build a scalable, future-oriented structure that supports growth, enhances productivity, optimises talent utilisation, and strengthens specialised capabilities. These models include:
Global Capability Centres (GCCs)
Centralised hubs that consolidate specialised expertise to build strategic capabilities and drive organisation-wide functional excellence.
Strategic Partnerships
Collaborative model where an external partner works closely with the Company under full accountability through an open book operating concept.
Key features include:
- Transparent costing and resource deployment
- Full control retained by the Company over competencies, skill levels, and profiles of partner deputed personnel
- Joint governance to uphold capability standards, mandate & oversee training & certifications, and ensure development of both partners and employees
- Deep integration with business processes, allowing the partner to function as an extension of the internal workforce
PLPBC Model (Performance Linked Productivity Based Contract)
A structured contracting model linking partner performance to measurable productivity outcomes, strengthening accountability, service predictability, cost-efficiency, and access to specialised skills.
Other Hybrid Models
To optimise work distribution, balance cost and capability, and build future-ready organisational capacity.
Talent Acquisition and Retention Strategy
Talent acquisition is now a strategic engine for growth and not just a transactional hiring function. In a landscape of skill scarcity, digital disruptions, demographic shifts, and changing employee expectations, the ability to secure top talent dictates organisational agility. By prioritising recruitment as a core leadership lever, organisations secure a competitive edge and future-proof their workforce against volatility. Talent acquisition is now a mission-critical priority due to the following reasons:
- Talent availability defines business growth, moving beyond a simple HR concern
- Skill mismatches, high competition for critical roles, and workforce mobility create high-stakes operational challenges
- Although remote and gig models broaden the talent pool, they intensify competition for the top talent
- Recruitment quality directly impacts innovation, productivity, retention, and culture
We are shifting from reactive hiring to a competitive talent ecosystem. By strengthening our talent pipeline, succession planning for critical roles and culture & value-driven employer branding, we don’t just fill roles, we secure our future. This strategy reduces hiring risks, accelerates targeted recruitment, and attracts top talent, ensuring long-term business continuity.
Board Talent Acquisition Scorecard
Our talent acquisition scorecard provides a single-page view of whether talent acquisition is enabling or constraining business strategy. By evaluating pipeline depth, hire quality and DEI performance, we mitigate execution risks, ensure leadership continuity to enable business growth. This data-driven approach optimises hiring speed, quality and brand strength, turning human capital into a core strategic lever for sustainable and future-ready competitive advantage.
Cadre Hiring
Under the Cadre hiring approach at the Adani Group, we onboard and develop Graduate and Post-Graduate Engineers in a structured manner, creating a robust pipeline with strong technical depth, leadership potential and alignment to organisational values.
This approach builds and strengthens the “bottom of the pyramid”, ensuring internal talent development, improved workforce stability and long-term leadership continuity.
Cadre Hiring Highlights at the Adani Group Level in FY 2025-26
3,174+ graduate and postgraduate engineers onboarded over the past three years strengthening the early career talent base at scale
Progressive reduction in average workforce age, strengthening agility, and succession preparedness
Structured first year development journeys encompassing Group induction, business-specific technical training, behavioural and soft skills development, and on-the-job technical exposure
Performance-linked development opportunities, including higher education sponsorships for high performing talent
Quarterly performance and assimilation reviews to enable effective integration, continuous capability building and ongoing refinement of the programme
3,517 (43.3%)
Permanent workforce in FY 2025-26
4,610 (56.7%)
Contractual Workforce in FY 2025-26
770
New Hires in FY 2025-26
▲84% from the previous year
Fair and Inclusive Hiring
Adani Energy Solutions ensures fair and inclusive hiring through a structured Diversity, Equity, and Inclusion (DE&I) policy that strictly prohibits discrimination in all forms. based on race, gender, age, or disability. The Company uses AI-driven evaluation tools (WeCP) to standardise assessments, promotes pay parity, and actively recruits individuals with disabilities.
Key pillars of their approach include:
Zero Tolerance Policy
Stringent policies against discrimination or harassment based on sex, age, disability, sexual orientation, disability or religion, ensuring equitable opportunities for all candidates.
Diverse Workforce Initiatives
Active efforts to increase gender diversity across all organisational levels, aiming for 30% women in the workforce by FY 2029-30.
Inclusive Hiring Processes
Implementation of fair practices to hire and retain Differently-abled People (DAP), providing them with equal opportunities.
Modernised Skill Evaluation
Utilisation of automated tools like WeCP for skill evaluation to ensure objectivity and reduce bias during technical recruitment.
Fair Compensation
Commitment to gender pay parity and hiring based on skills, experience, and talent rather than personal characteristics.
Inclusive Outreach
Utilising the Adani Foundation, which focusses on skill development for varied talent pools.
Internal Talent Mobility
Adani Energy Solutions fosters internal talent mobility through a “people-first” culture that leverages HRMS for real-time career tracking and skill-based matching. Adani Energy Solutions promotes growth through extensive technical training, leadership development, and cross-functional opportunities, aiming to upskill employees to fill critical roles across its diverse transmission and distribution projects.
Percentage of Open Positions Filled by Internal Candidates
Inclusive Development Through Local Hiring
Adani Energy Solutions fosters inclusive development by prioritising local hiring and community engagement, ensuring project benefits are shared locally. Through the Adani Foundation, they implement skill development, provide training for marginalised groups, and create livelihood opportunities in areas such as agriculture, carpentry, and sewing to empower local communities.
Key Initiatives for Inclusive Development and Local Hiring:
- Skill Development and Training: The Adani Skill Development Centre provides specialised training for local youth in sectors like IT, construction, and healthcare to make them job-ready, with specific focus on empowering women and differently-abled individuals.
- Community-Based Livelihood Projects: In collaboration with organisations like NABARD, Adani Energy Solutions, through its Integrated Tribal Development Project, supports local, landless families by providing skills and equipment for sustainable incomes, such as tailoring and goat farming.
- Local Hiring in Operations: Adani Energy Solutions actively engages local communities in its projects, ensuring that its growth contributes directly to the economic progress of the region where it operates.
- Capacity Building for Marginalised Groups: Initiatives like the Make India Capable (MIC) programme in partnership with NGOs, focus on training individuals from underprivileged backgrounds (including those below the poverty line) for gainful employment.
- ESG Framework: The Company’s ESG committee, composed of independent directors, oversees and enforces inclusive hiring and social responsibility policies, ensuring sustainable development.
At significant operational locations, the Company maintains a strategic commitment to local empowerment by ensuring that 100% of senior management positions are filled by individuals from the surrounding communities. In the context of Adani Energy Solutions’ operations in India, “local” refers to suppliers, vendors, and potential employees situated within the geographic regions where the Company maintains substantial business activities. These regions include major metropolitan areas, operational hubs, and key markets associated with the Company’s core services, such as power transmission and distribution, smart meter deployment, and cooling solutions.
The term emphasises economic engagement that avoids transnational transactions, thereby ensuring that financial benefits are retained within the communities where the Company operates.
This approach strengthens the Company’s connection with local stakeholders, fosters cultural alignment, and enhances responsiveness to regional needs. By embedding leadership within the communities it serves, the Company supports inclusive decision-making and contributes meaningfully to sustainable development and long-term socio-economic growth.
770
of local hires in the overall talent pool in FY 2025-26
100%
of senior management at Adani Energy Solutions hired locally in FY 2025-26
Adani Skills & Education (ASE): Building Livelihoods Through Future-Ready Skills at the Adani Group
Adani Skills & Education (ASE) promotes inclusive growth by equipping the workforce and youth from tier 3 and tier 4 towns near the operational locations with industry-relevant skills. The target group includes women, first-generation learners, and existing employees. The focus is on creating and enhancing social impact and business sustainability by generating livelihoods with dignity and fostering inclusive economic participation.
Impact
10,000+
individuals trained
9,000+
placed in first time employment
Ongoing upskilling of existing employees
on digital capabilities
Average monthly new hires and average hiring cost/FTE (₹ crore)
*Drastic reduction due to internal hiring and inter-group hiring.
FTE is the Head count at the end of the reporting period i.e. as of March 31, 2026
Employee Turnover Rate (%)
| Employee Turnover | FY 2023-24 | FY 2024-25 | FY 2025-26 | |||||||
|---|---|---|---|---|---|---|---|---|---|---|
| Male | Female | Total | Male | Female | total | Male | Female | total | ||
| Permanent Employees | Average Turnover rate | 7.3 | 6.3 | 7.1 | 7.1 | 9.1 | 7.3 | 4.5 | 1.9 | 6.4 |
| Average Voluntary Turnover rate | 2.4 | 3.2 | 5.6 | 5.0 | 8.4 | 5.2 | 4.5 | 1.9 | 6.4 | |
| Permanent Workers | Average Turnover rate | 8.3 | 7.8 | 8.2 | 8.9 | 7.5 | 8.8 | 24.9* | 2.7* | 27.6* |
| Average Voluntary Turnover rate | 8.3 | 7.8 | 8.2 | 8.9 | 7.5 | 8.8 | 24.9* | 2.7* | 27.6* | |
*High Turnover due to restructuring of business and group company internal transfers
*Permanent Workers : 24.6% out of 24.9% Male and 2.6% out of 2.7% Females = 26.7% out of 27.6% Total were due to voluntary retirement.
Note: New hires and employee turnover are monitored annually and reviewed by senior management to assess workforce stability and talent risks.
Our Capability building centres on three critical dimensions:
Strategic Alignment
Programmes driven by organisational requirements and the STRAP roadmap to enable large-scale transformation.
Role Excellence and Critical Skill-Building
Targeted programmes focussing on job-specific technical and critical skills such as HVDC, STATCOM and Substation Digitalisation, Asset Performance Management, etc.
Personalised Growth
Individual Development Plans identified through competency mapping tools

Our organisation fosters a structured learning ecosystem designed to synchronise individual growth with strategic transformation. By anchoring development in our long-term roadmap, we ensure our workforce remains future-ready. Employees are empowered through the Percipio digital platform that offers self-paced access to diverse functional and behavioural learning journeys.
Strategic Capability Building Programmes

Digital Dexterity Programmes
Curated modules to enhance digital awareness and adoption covering the following topics:
- Next-Gen Tech: IoT, IIoT, Robotics, Digital Twins, Blockchain, AR/VR, 3D Printing
- Data & Intelligence: Analytics, AI Essentials and Data Management
- Agile Methodologies: Design Thinking, Business Model Innovation, Digital Project Management
- Infrastructure: Computing Paradigms, such as Cloud & Edge Computing, Lifecycle Management
Digital Dexterity programme had enabled the digital literacy of all employees to ensure future readiness.
Employees covered through digital skills upgradation programmes in FY 2025-26: 100%

Knowledge Management and Subject Matter Expertise
We identify and enable internal Subject Matter Experts (SMEs) who collaborate with Learning & Development to cultivate Centres of Excellence (COE) in various functional domains. These SMEs institutionalise critical technical skills through “Power Up Sessions” in:
- Grid Infrastructure: Basics of GIS, HVDC Transmission System and its application, FACTS, Transmission Line and O&M practices
- Asset Governance: Asset Health Indexing (AHI), Asset Performance Management (APM), ENOC Operations
- Regulatory and Security: OT-Cyber Security, and Right-of-Way regulatory insights, Market Insights & Bidding Fundamentals
Enhancing organisational learning and creating knowledge management repository.
6 SMEs were developed 60% employees were covered through the SME-led “Power Up Sessions”

Technical/Functional Competency Building
The Oracle Saksham platform enables a structured framework to assess functional & behavioural competencies vis-à-vis the desired proficiency levels. Through career conversations, the employees are empowered to prepare Individual Development Plans to drive professional growth.

Foundational Integration for Graduate Engineer Trainees (GETs)
Our three-month structured orientation ensures the next generation of talent is fully aligned with our core values, organisational vision and cross-functional business understanding from day one. 104 GETs participated in the orientation programme in FY 2025-26
Measuring Training Effectiveness
Average training hours and training investments are tracked annually, and the effectiveness of key programmes is assessed through participation levels, learner feedback, and application of skills at the workplace.
Future-Ready Learning Highlights at the Adani Group Through Digital e-Vidyalaya Platform in FY 2025-26
Scaling Learners’ Participation
8,22,033 course completions reflecting strong learner engagement
8,03,167 learning hours, averaging
30.2 hours per learner
Strengthening Competencies Through Industry Certifications
494 employees completed industry-recognised certification prep programmes such as PMP, CAPM, CISSP, Power BI and others through the LIVE Bootcamp series
Bespoke Content Strategy
97 custom learning assets were developed in-house and made available on the platform
1,822 functional and business-specific content assets were curated to meet specialised role requirements
Learner Satisfaction and Advocacy
Net Promoter Score (NPS) of 70.1 indicates strong learner advocacy
95% of learners successfully applied new skills at their work, demonstrating the practical relevance of the content
89% average learner satisfaction rate confirms the quality, relevance, and delivery excellence of the content
Digital Dexterity Programme Achievements
Adani Digital Dexterity Programme successfully developed, with all 14 journeys launched in the first week of March 2026
58,355 Digital Dexterity journeys completed, driving digital fluency and future-readiness across the organisation
Training Highlights in FY 2025-26
₹ 1.31 crore
Expenditure on employees’ training and development
₹ 1,612
Average training investment per FTE
10.9
Average training hours for the workforce
43.5 hours
Average hours of training for permanent employees
1.8 hours
Average hours of training for contract workers
30,586
Hours of training provided for digital and analytical skills upgradation
47,746
Hours of training provided for technical skills upgradation
1,04,990
Hours of training provided for behavioural skills upgradation
Average training investment per FTE (in ₹)
Note: Drastic reduction due to adoption of mass on-line training modules
Enabling Just Transition
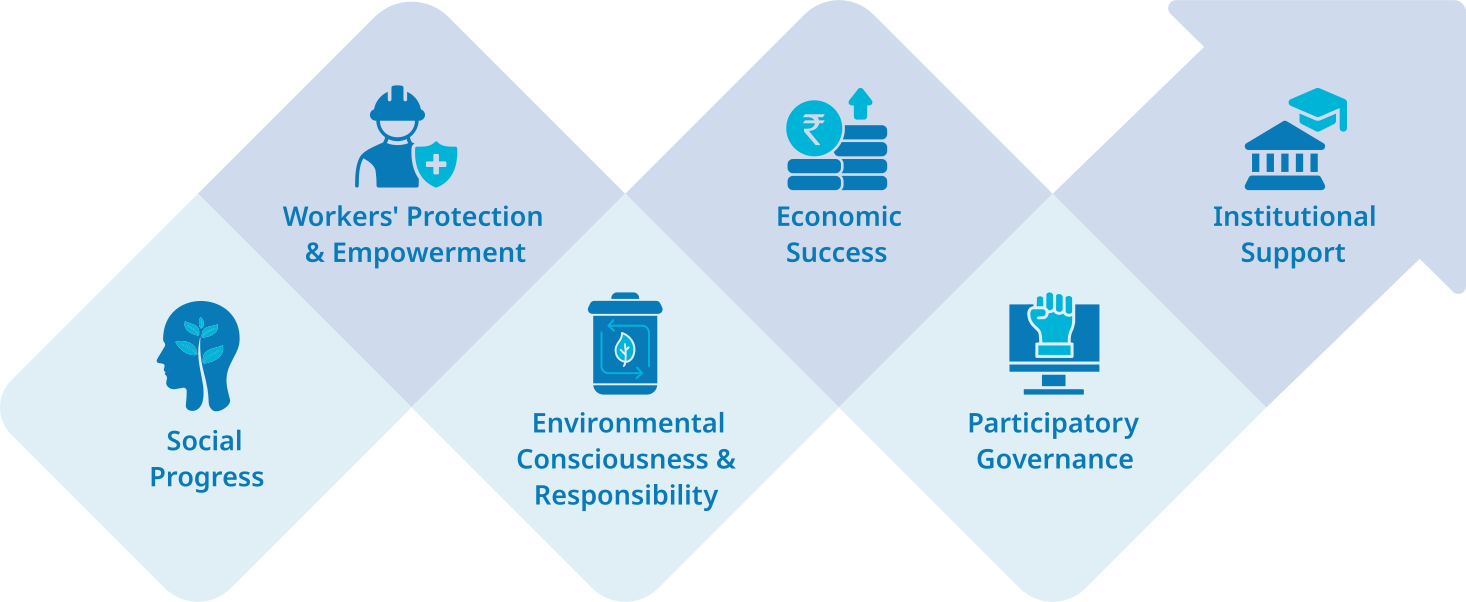
Adani Energy Solutions emphasises a responsible and just transition through its “Growth with Goodness” philosophy, integrating Environmental, Social, and Governance (ESG) principles into its core business strategy to support its workforce and communities during industrial transformation. As the Company shifts towards renewable energy transmission, smart metering, and green distribution, it focusses on skill development, safety, and community empowerment.
Workforce Transition and Empowerment
- Upskilling for Green Jobs: To meet the demands of a dynamic energy sector, Adani Energy Solutions has upskilled more than 100 individuals in critical transmission competencies, such as foundation work, erection, and stringing.
- Technical Training: The Company provided 11.1 man-days of training per employee in technical and leadership areas, ensuring staff are equipped for new technologies like smart metering.
- Safety First: Workplace safety is a priority, with senior management involved in reviewing safety observations and incidents to protect workers from operational risks.
Community Support and Just Transition
- Targeted CSR Initiatives: Through the Adani Foundation, Adani Energy Solutions engages with communities near substations and transmission lines, focussing on education, community health, and social welfare.
- Sustainable Livelihoods: The Company supports local communities through initiatives like “SuPoshan” (nutrition), “Saksham” (skill development), and “Udaan” (education).
- Inclusive Growth: In areas with significant operational presence like Mumbai, the Company focusses on skill development, quality of life improvement, and safety awareness.
- Empowering Marginalised Groups: Programmes specifically target women, children, differently abled people, and tribal communities to promote socio-economic empowerment, such as the ‘Wadi’ project for tribal families in Dahanu.
- Support for Small Producers: The Company aims to boost local economies by sourcing from micro, small, and medium enterprises (MSMEs), with 34% of procurement directly sourced from such groups in FY 2025-26.
Handling Operational Changes
- Environmental and Social Impact Assessment: For new projects, Adani Energy Solutions conducts rigorous Environment and Social Impact Assessments (ESIA) to mitigate potential negative effects on surrounding areas.
- Biodiversity Preservation: The Company practices “No Net Loss” of biodiversity and conducts compensatory afforestation for any forest land encountered during projects.
Green Technology Focus:
Adani Energy Solutions is investing in green transmission and distribution, including a USD 1 billion HVDC line to support Mumbai’s sustainable energy needs.
These efforts are guided by a Board-level Corporate Responsibility Committee (CRC), ensuring that transition efforts are ethical and align with sustainable development goals.
Aligned with the Adani Group framework, Adani Energy Solutions’ standalone Diversity, Equity & Inclusion (DEI) Policy ensures equal opportunity employment and non-discrimination across gender, caste, religion, age, disability, sexual orientation, and ethnicity. Supported by Human Rights Policy and POSH (Prevention of Sexual Harassment) Policy, the DEI principles are embedded across recruitment, promotions, compensation, performance management, and leadership development, with oversight through defined reporting mechanisms.
Promoting Fair and Inclusive Culture
- Providing training for POSH, anti-harassment, non-discrimination, and cultural sensitivity for all employees to reduce unconscious bias
- Ensuring fair and equitable learning and career progression opportunities to all employees, including women employees
- Ensuring accessibility and reasonable workplace accommodation for people with disabilities, as outlined in the DEI policy
- Maximising diverse Young Talent hiring (GET, ET, MT) and identifying gender neutral roles at both corporate and site locations
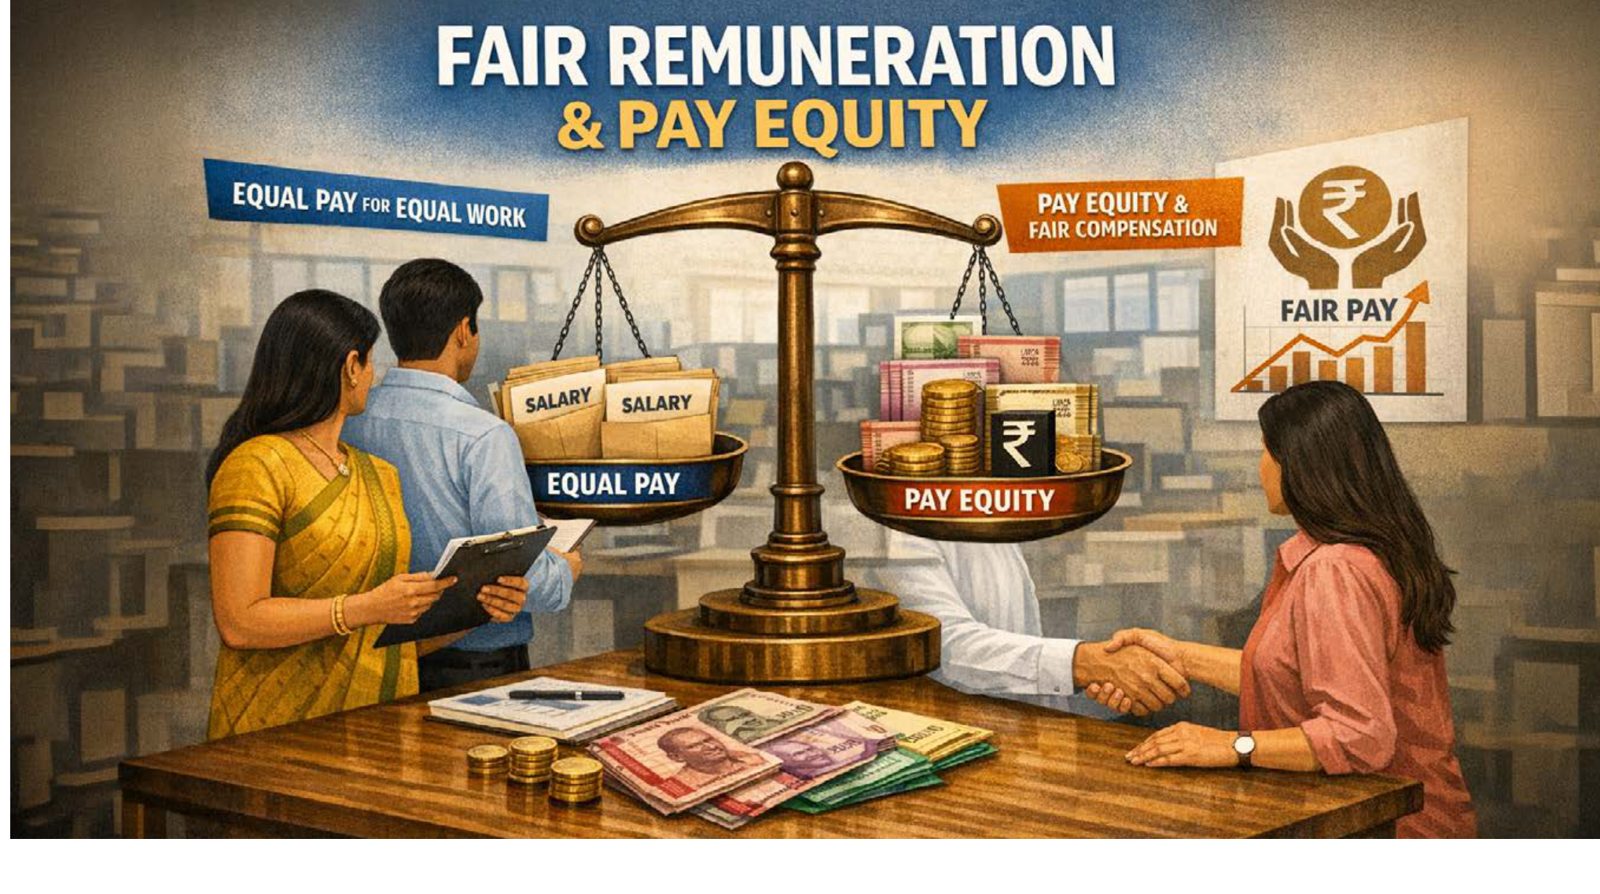
Gender Pay Parity
The Company upholds gender-neutral compensation practices, ensuring that remuneration is determined solely by role, responsibility, experience, and industry benchmarks, free from bias or discrimination. Every employee and worker is paid above the statutory minimum wage, in full compliance with regional regulations, with consideration for their skill set and contribution. Our fair and equal pay commitment is validated through independent third-party assessments.
In FY 2025-26, the ratio of standard entry level wage to local minimum wage stood at 2.93:1 for male employees and 2.48:1 for female employees, while all workers, regardless of gender, received wages at or above the statutory minimum (1:1). 100% of Adani Energy Solutions’ direct operations workforce earn a basic salary equal to 248% or up to 293% above the legal minimum wage.
Employee Wellbeing and Support
At the Adani Group, we prioritise holistic well-being to cultivate a resilient and high-performing workforce. By investing in the physical, mental and financial wellbeing, we ensure employee vitality through on-site safety for all personnel, preventive healthcare and dedicated mental health support systems.
- First aid and CPR training for emergency preparedness
- Health awareness sessions on communicable and non-communicable diseases
- Anti-substance abuse drives against smoking and the consumption of tobacco and alcohol
- Periodic health camps for nearby communities, extending healthcare access
- Women’s health programmes to promote gender-responsive healthcare practices
Approach
- Health insurance & pre-employment health screening
- Mandatory annual health check-ups to track year-on-year health trends
- Cashless hospitalisation support for employees and their families
- Teleconsultation programme through OccuCare Platform for primary and specialist care
- Digital health enablement via EmCare Mobile Application
Wellbeing
- Diet & nutrition consultation to prevent lifestyle-related disorders
- Yoga & mental well-being sessions for employees and their families
- Ergonomic & physiotherapy programmes for posture and musculoskeletal issues
- Dedicated Employee Assistance Programmes (EAPs) offering counselling and mental health support
- Email-based awareness campaigns on seasonal illnesses and lifestyle disorders
Approach
Improvement
Employee benefits provided to permanent employees also include provident fund, gratuity, insurance, paid leave, and wellness programmes, in accordance with applicable labour laws.
The Adani Group places strong emphasis on psychological safety, enabling employees to express views, raise concerns and share ideas without fear of retaliation.










The Adani Group’s Workmen Welfare Initiatives at Remote Project Locations
Ensuring safety and wellbeing of our workers, both skilled and unskilled, at the remote operational and manufacturing locations is an utmost organisational priority. The organisation implements several measures to ensure their physical safety, mental wellbeing and dignified living conditions.
Worker Welfare Infrastructure
Safe and Hygienic Accommodation
- Large scale residential facility created for ~25,000 workers with medical rooms, recreation and green areas
- Centralised kitchen with a capacity of ~1.2 lakh meals per day ensures nutritious and hygienic meals
Sanitation Infrastructure Across Project Sites
- Deployed 55+ sanitation blocks with eco-friendly systems to prevent groundwater contamination and environmental degradation
Rest Shelters for Occupational Health and Safety
- Introduced rest shelters at construction sites, with clean drinking water, shade and dining spaces, protecting refuge against harsh weather and reducing fatigue-related risks
- Currently, 16 shelters are operational at Mundra
Standardised Accommodation Labour Colonies
- Modular, scalable housing (1,000 – 5,000 pax configurations) are being implemented near construction sites for unskilled and construction labour
Meaningful Employee Engagement
The Adani Group values employee engagement as a driver of innovation and organisational growth. We maintain a high-performance culture by integrating transparent and open communication. We offer several professional learning & development opportunities and career advancement programmes to help employees thrive.
Continuous Dialogue
Quarterly townhalls, leadership site visits and an “Open Door” policy ensure transparent business updates, feedback and interactions.
Structured Integration Programmes
Curated onboarding programmes for GETs and lateral hires, alongside the manager and team member assimilation.
Rewards & Recognitions
Significant employee contributions and exceptional commitment in demonstrating the Adani values both at work and beyond the call of duty are honoured through Spot Recognition Awards and other exclusive awards.
Employee Feedback
Periodic employee engagement surveys help gauge employee sentiment, helping to identify opportunities to enhance employee experience.
Group-Level Engagement Initiatives
Blood Donation Drive
Since 2011, we have commemorated our Chairman’s birthday on June 24 each year with a blood donation camp across all our business locations. In FY 2025-26, widespread participation from our employees, their family members and our contractors led to a total collection of 28,090 units and ~11,236 litres of blood. Since 2011, we have donated total 1,43,151 units of blood, which has contributed towards saving approximately 4.5 lakh lives.
Leadership-Led Townhalls
During the year, the employees were engaged through the Parivar Ki Baat Townhall series led by Shri Karan Adani.
Listening to Our Employees
Adani Energy Solutions’ Employee Satisfaction Score (based on D,E&I Survey)
| Scale and percentage | FY 2023-24 | FY 2024-25 | FY 2025-26 | Target | |
|---|---|---|---|---|---|
| Employee Engagement Score | 0 – 5 | 3.99 | 4.04 | 4.17 | 4.15 |
| % | 79.8 | 80.7 | 83.4 | 82.5 | |
| Data Coverage (% of Employees covered) | % | 21 | 25 | 38 | 90 |
Adani Group Engagement Survey: Acting on Employees’ Voice
Guided by the insights from a Chairman-led, organisation-wide employee engagement survey, conducted between November 2023 and March 2024, the Adani Group has strategically refined its policies, processes, and systems to elevate the overall employee experience. The following major strategic outcomes can be attributed to the survey-driven insights:
Pay-for-Performance Revamp
- Introduced a transparent, tiered variable pay system impacting 36,000+ employees across the Group
- Improved earnings potential for employees - Top performers: up to 120% of variable pay; Strong performers: 100%; Good performers: 70%
Internal Talent Mobility Enhancement
- Launched a new IJP policy enabling cross-BUs career opportunities
- Saksham platform prioritises internal job postings for internal candidates
- 2,900+ successful internal transitions, boosting retention and career growth (until January 2026)
HR Services Digitisation
- Shifted to a 24/7 self-service model via Oracle, reducing service turnaround from 3–5 days to instant access
- Employees can now complete tasks like updating bank details or applying for loans in just 3 clicks
Travel & Claims Policy Overhaul
- Reduced travel approval chain from 8 to 2 levels and introduced a Per Diem model for faster reimbursements
- Launched Quest Travel portal for dynamic bookings and improved guesthouse experiences
- Travel benefits extended to family members of Adani Parivar
Way Forward: The Adani Group’s HR Priorities for FY 2026-27
- Expanding cadre intake by 15%
- Launching a digital-first learning academy
- Implementing AI-assisted workforce planning tools
- Enhancing inclusion metrics and accessibility mapping
- Full scale adoption of remaining labour code rules
- Deepening community livelihood partnerships
Upholding Human Rights and Labour Relations
At the Adani Group, we uphold the highest standards of workplace integrity and human rights, ensuring our operations, and supply chains remain ethical, safe and inclusive. Our commitment is guided by globally recognised frameworks, including the Universal Declaration of Human Rights, ILO Core Labour Standards and the UN Guiding Principles on Business and Human Rights.
The Company does not engage in or support human trafficking in any form and is committed to eliminating all forms of forced and compulsory labour. The Company does not use prison labour in its value chain.
The Company pledges to provide or cooperate in remediation where it has caused or contributed to adverse human rights impacts. The Company has included mechanisms for grievance reporting, fair and transparent resolution processes, and support systems such as counselling and compensation where appropriate. These commitments are embedded within the Company’s broader sustainability and governance framework, reinforcing its role as a responsible corporate actor in the energy sector.
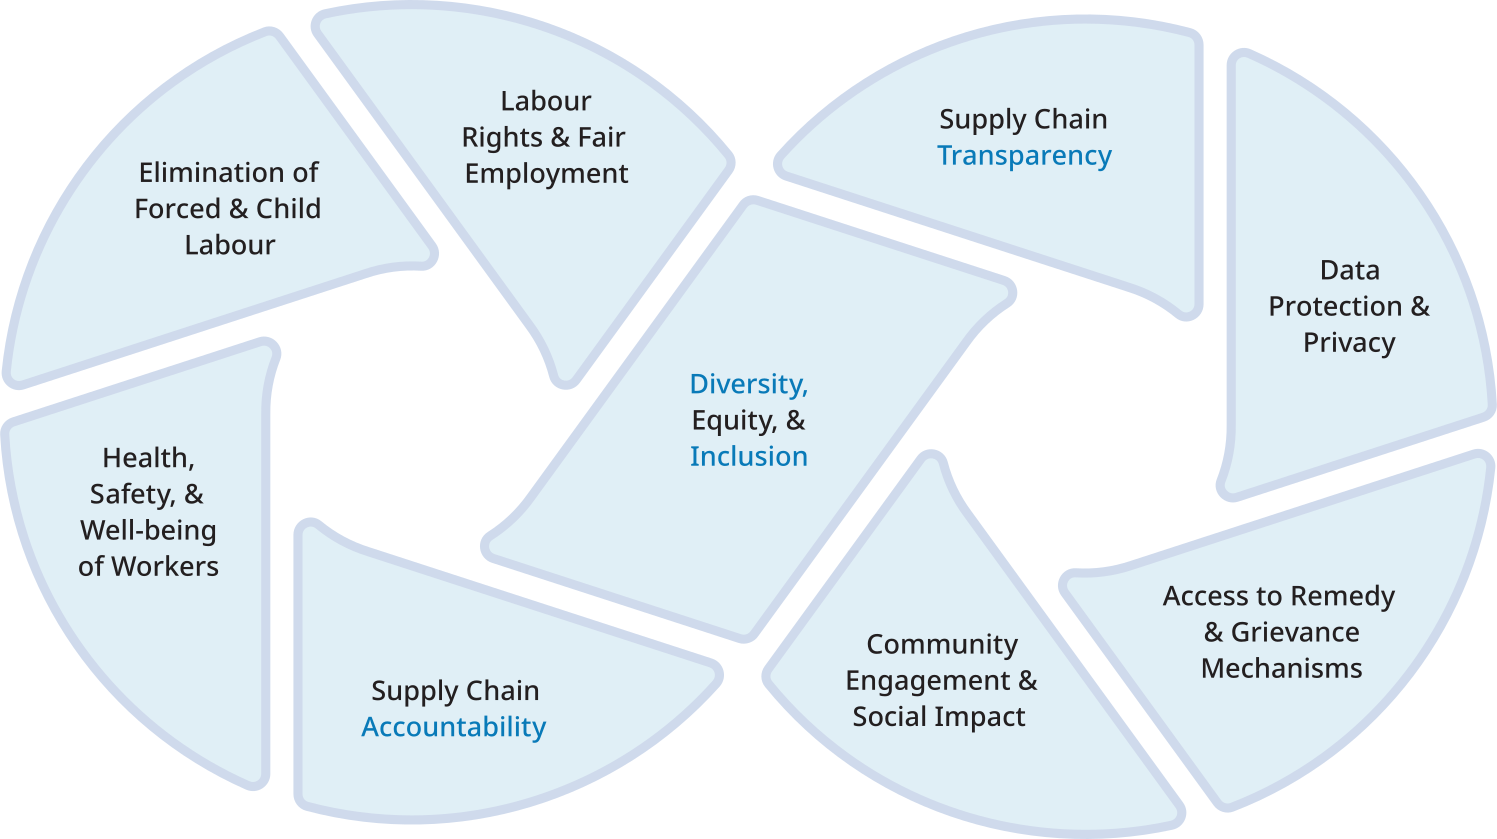
In its value chain, the Company deploys supply chain focussed assessments that include independent third-party audits, vendor scorecards, and tailored risk mappings aligned with SA 8000 standards. The Company’s Supplier Code of Conduct sets clear benchmarks for ethical labour practices, environmental responsibility, and compliance expectations. Human rights due diligence informs which geographies, supplier tiers, or worker types require deeper scrutiny. This due diligence also shapes procurement decisions and supplier onboarding protocols, ensuring alignment with the Company’s values and legal obligations.
Workplace Rights and Governance
We maintain a Zero Tolerance policy toward forced or child labour and strictly enforce non-discrimination. Our governance is ensured by ESG oversight committees that conduct rigorous human rights due diligence and supplier assessments to ensure end-to-end compliance.
During FY 2025-26, 6,123 contractual workers, comprising approximately 75.34% of its total workforce, are affiliated with recognised trade unions and collective bargaining agreements. This statistic reflects the Company’s proactive engagement with labour representatives and its support for collective representation, dialogue, and grievance resolution.
The Company continues to foster cooperative relationships with trade unions and worker bodies, ensuring their involvement in workforce consultations, human rights risk assessments, and resolution mechanisms across business operations and supplier engagements.
Policy Commitment
The Code of Conduct(s) and Business Policies adopted by the Company emphasises:
⊕For more information on the ethical supply chain, please refer to ‘Responsible Sourcing’ on Pg. 286
Our workforce is governed by robust regulatory framework:
- Executives: Code of Conduct and Certified Model Standing Orders ensure discipline and other service conditions for the employees working in the Executive Cadre and non-executives, respectively
- Compliance and Accountability: A culture of accountability is fostered through regular training and awareness sessions for all new and existing workforce including security teams and third-party security personnel, on key policies and conduct guidelines.
- Continuous Improvement: We periodically review our corporate governance practices and guidelines against global best practices, ensuring their ongoing relevance, effectiveness and responsiveness to the stakeholders needs.
Access to Remedy
Adani Energy Solutions provides structured forums for the employees and the workers union to raise their concerns and seek effective remediation. These forums include Divisional Grievance Committees, Canteen Committees, Safety Committees and Apex Committee.
⊕Read more in BRSR on Pg. 431 onwards
Ensuring Stability of Industrial Relations
We foster positive industrial relations through open communication and constructive partnerships with unions.
By maintaining ongoing awareness of relevant policies and adhering to compliance standards, the Company promotes a stable and productive workplace for all employees.
Structured labour-management frameworks are established to facilitate timely and proactive discussions regarding operational changes and matters concerning the workforce. These mechanisms include recognised worker forums, grievance committees, and regular engagement with employee representatives. Where applicable, collective bargaining agreements are observed, and the Company is committed to preserving harmonious industrial relations throughout its operations.
Notice Period During Significant Operational Changes
The Company provides a minimum notice period of 30 days to employees and their representatives prior to implementing significant operational changes that could substantially affect them. This ensures adequate time for dialogue, preparation, and support.
For employees covered under collective bargaining agreements, the notice period and provisions are aligned with the terms stipulated in those agreements, ensuring compliance with negotiated protocols and mutual understanding between the Company and employee representatives.
The Group is fully prepared to comply with the remaining provisions once the necessary rules (which are expected to be effective from April 1, 2026) are released. Internal systems and SOPs have been pre-aligned for swift adoption, underlining the organisation’s commitment to stringent adherence with all the relevant legislations and rules.
Adoption of New Labour Codes
In compliance with the New Labour Codes, as notified by the Government of India on November 21, 2025, we have implemented all the applicable provisions across our HR systems. We have also established cross-functional compliance committees for future-readiness. Digitalisation of registers, wage structures, and contractor-related documentation are other key facets of this strategy. We have initiated awareness programmes to update our employees and contractors with the new codes.
⊕Read more about our People, Human Rights and Labour Practices in BRSR from Pg. 431 onwards.
Breakdown of the Workforce Composition
| Workforce Composition | Male (Age in years) | Female (Age in years) | Grand Total | Share | ||||||
|---|---|---|---|---|---|---|---|---|---|---|
| <30 | 30-50 | >50 | Total | <30 | 30-50 | >50 | Total | |||
| Management Level workforce categories | ||||||||||
| Top Management | 0 | 0 | 4 | 4 | 0 | 0 | 0 | 0 | 4 | 0% |
| Senior Management | - | 22 | 53 | 75 | - | 1 | - | 1 | 76 | 1% |
| Middle Management | 6 | 484 | 254 | 744 | 5 | 4 | 13 | 82 | 826 | 10% |
| Junior Management | 413 | 306 | 16 | 735 | 116 | 7 | 1 | 124 | 859 | 11% |
| Management Trainees | 2 | 0 | 0 | 2 | 0 | 0 | 0 | 0 | 2 | 0% |
| Outsourced | 0 | 0 | 0 | 0 | 0 | 0 | 0 | 0 | 0 | 0% |
| Total Permanent Workforce | 421 | 812 | 327 | 1,560 | 121 | 72 | 14 | 207 | 1,767 | 22% |
| % of Management level workforce | 24% | 46% | 19% | 88% | 7% | 4% | 1% | 12% | 100% | |
| % of category workforce | 5% | 10% | 4% | 19% | 1% | 1% | 0% | 0% | 22% | |
| Non-Management Level workforce categories | ||||||||||
| Outsourced | 452 | 2,816 | 1,256 | 4,524 | 2 | 38 | 46 | 86 | 4,610 | 57% |
| Contractual Workers | 0 | 0 | 0 | 0 | 0 | 0 | 0 | 0 | 0 | 0% |
| Permanent Workers | 0 | 479 | 1,205 | 1,684 | 0 | 24 | 42 | 66 | 1,750 | 22% |
| Sub Total (b) | 452 | 3,295 | 2,461 | 6,208 | 2 | 62 | 88 | 152 | 6,360 | 78% |
| % non-management total (b1) | 7% | 52% | 39% | 98% | 0% | 1% | 1% | 2% | 100% | |
| % of Category workforce (b2) | 6% | 41% | 30% | 76% | 0% | 1% | 1% | 2% | 78% | |
| Total Workforce (a+b) | 873 | 4,107 | 2,788 | 7,768 | 123 | 134 | 102 | 359 | 8,127 | 100% |
| % total workforce | 11% | 51% | 34% | 96% | 2% | 2% | 1% | 4% | 100% | |
Adani Energy Solutions does not have any employees categorised under the gender classifications ‘Other’ or ‘Not Disclosed’.
The Workforce comprises permanent employees and contractual workers, engaged across corporate offices, project sites, and operational locations.
“Employees” refer to individuals on the Company’s payroll, while “contractual workers” include personnel engaged through third-party contractors for project execution and operations.
The workforce comprises full-time personnel, fixed term staff, project-based professionals, independent contractors, interns, and trainees. All employees are full term employees.
Adani Energy Solutions maintains a 100% Indian national representation across its permanent employee base and management workforce, with zero foreign nationals employed.1
As of March 31, 2026, workforce metrics reflected the influence of market conditions and strategic developments. Key fluctuations during the reporting period were attributable to:
- Project Completion: Closure of large scale initiatives resulted in the release of temporary personnel engaged specifically for those assignments.
- Business Expansion: New projects and ventures into emerging markets drove targeted recruitment, particularly for technical and specialised capabilities.
- Organisational Restructuring: Efficiency focussed realignments impacted departmental staffing, yielding both reductions and redeployments across units.
1 CSA S&P 3.1.5
Workforce Breakdown by Significant Operating Locations2
Significant locations of operations are defined as geographic areas within India where Adani Energy Solutions has a notable business presence or conducts substantial operational activities. These include regions with critical infrastructure, concentrated customer bases, and strategic relevance to the Company’s service offerings in power transmission and distribution, smart metering, and cooling solutions.
| Location | Male | Female | Total | |||
|---|---|---|---|---|---|---|
| Mumbai | 7,036 | 87% | 337 | 4% | 7,373 | 91% |
| Ahmedabad | 264 | 3% | 21 | 0% | 285 | 4% |
| Mundra | 56 | 1% | 0 | 0% | 56 | 1% |
| Khavda | 46 | 1% | 0 | 0% | 46 | 1% |
| Rewa | 22 | 0% | 0 | 0% | 22 | 0% |
| Mahendragarh | 21 | 0% | 0 | 0% | 21 | 0% |
| Jamnagar | 20 | 0% | 0 | 0% | 20 | 0% |
| Bhuj | 17 | 0% | 0 | 0% | 17 | 0% |
| Pune | 14 | 0% | 0 | 0% | 14 | 0% |
| Bikaner | 8 | 0% | 0 | 0% | 8 | 0% |
| Other | 264 | 3% | 1 | 0% | 265 | 3% |
| Grand total | 7,768 | 95.6% | 359 | 4.4% | 8,127 | 100% |
| Regions in India | Number of Employees | % of Employees w.r.t. Total |
|---|---|---|
| India - West | 7,920 | 97.5% |
| India - South | 34 | 0.4% |
| India - North | 98 | 1.2% |
| India - East | 20 | 0.2% |
| India - Central | 55 | 0.7% |
| Other than India | 0 | 0.0% |
| Total | 8,127 | 100% |
1 WDI 3.2, WDI 3.2a-3.2b
New hires in FY 2025-26
| Workforce Composition | Male (Age in years) | Female (Age in years) | Grand Total | Share | ||||||
|---|---|---|---|---|---|---|---|---|---|---|
| <30 | 30-50 | >50 | Total | <30 | 30-50 | >50 | Total | |||
| Management Level workforce categories | ||||||||||
| Top Management | 0 | 0 | 0 | 0 | 0 | 0 | 0 | 0 | 0 | 0% |
| Senior Management | 0 | 0 | 2 | 2 | 0 | 0 | 0 | 0 | 2 | 0% |
| Middle Management | 0 | 23 | 3 | 26 | 0 | 0 | 0 | 0 | 26 | 3% |
| Junior Management | 91 | 70 | 0 | 161 | 26 | 0 | 0 | 26 | 187 | 24% |
| Management Trainees | 2 | 0 | 0 | 2 | 0 | 0 | 0 | 0 | 2 | 0% |
| Outsourced | 0 | 0 | 0 | 0 | 0 | 0 | 0 | 0 | 0 | 0% |
| Total Permanent Workforce | 93 | 93 | 5 | 191 | 26 | 0 | 0 | 26 | 217 | 28% |
| % New Hire of Management level workforce | 43% | 43% | 2% | 88% | 1% | 0% | 0% | 12% | 100% | |
| % New Hire of Category workforce | 12% | 12% | 1% | 25% | 3% | 0% | 0% | 3% | 28% | |
| Workforce Composition | Male (Age in years) | Female (Age in years) | Grand Total | Share | ||||||
|---|---|---|---|---|---|---|---|---|---|---|
| <30 | 30-50 | >50 | Total | <30 | 30-50 | >50 | Total | |||
| Non-Management Level workforce categories | ||||||||||
| Outsourced | 309 | 216 | 26 | 551 | 1 | 1 | 0 | 2 | 553 | 72% |
| Contractual Workers | 0 | 0 | 0 | 0 | 0 | 0 | 0 | 0 | 0 | 0% |
| Permanent Workers | 0 | 0 | 0 | 0 | 0 | 0 | 0 | 0 | 0 | 0% |
| Sub Total (b) | 309 | 216 | 26 | 551 | 1 | 1 | 0 | 2 | 553 | 72% |
| % New Hire non-management total (b1) | 56% | 39% | 5% | 99.6% | 0.2% | 0.2% | 0.0% | 0.4% | 100% | |
| % New Hire of Category workforce (b2) | 40% | 28% | 3% | 72% | 0.1% | 0.1% | 0.0% | 0.3% | 72% | |
| Total New Hired Workforce (a+b) | 402 | 309 | 31 | 742 | 27 | 1 | 0 | 28 | 770 | 100% |
| % New Hire of total workforce | 52% | 40% | 4% | 96% | 4% | 0% | 0% | 4% | 100% | |
Adani Energy Solutions does not have any new hire employees categorised under the gender classifications ‘Other’ or ‘Not Disclosed’.
Total Hires include all successful hires (full-time, part-time, and sometimes contractors) within the reporting period.
Average hiring cost per hire = Internal Recruiting Costs + External Recruiting CostsTotal Number of Hires
Employee Turnover in FY 2025-26
| Workforce Composition | Male (Age in years) | Female (Age in years) | Grand Total | Share | ||||||
|---|---|---|---|---|---|---|---|---|---|---|
| <30 | 30-50 | >50 | Total | <30 | 30-50 | >50 | Total | |||
| Management Level workforce categories | ||||||||||
| Top Management | 0 | 0 | 1 | 1 | 0 | 0 | 0 | 0 | 1 | 0% |
| Senior Management | 0 | 3 | 9 | 12 | 0 | 0 | 1 | 1 | 13 | 1% |
| Middle Management | 2 | 67 | 49 | 118 | 0 | 4 | 4 | 8 | 126 | 6% |
| Junior Management | 62 | 80 | 4 | 146 | 28 | 1 | 0 | 29 | 175 | 8% |
| Management Trainees | 0 | 0 | 0 | 0 | 0 | 0 | 0 | 0 | 0 | 0% |
| Outsourced | 0 | 0 | 0 | 0 | 0 | 0 | 0 | 0 | 0 | 0% |
| Total Permanent Workforce | 64 | 150 | 63 | 277 | 28 | 5 | 5 | 38 | 315 | 14% |
| % Turnover of Management level workforce (a1) | 20% | 48% | 20% | 87% | 9% | 2% | 2% | 13% | 100% | |
| % Turnover of category workforce (a2) | 3% | 7% | 3% | 12% | 1% | 0% | 0% | 2% | 14.0% | |
| Non-Management Level workforce categories | ||||||||||
| Outsourced | 390 | 729 | 209 | 1,328 | 20 | 27 | 4 | 51 | 1,379 | 61% |
| Contractual Workers | 0 | 0 | 0 | 0 | 0 | 0 | 0 | 0 | 0 | 0% |
| Permanent Workers | 0 | 31 | 475 | 506 | 0 | 4 | 50 | 54 | 560 | 25% |
| Sub Total (b) | 390 | 760 | 684 | 1,834 | 20 | 31 | 54 | 105 | 1,939 | 86% |
| % Turnover non-management total (b1) | 20% | 39% | 35% | 95% | 1% | 2% | 3% | 5% | 100% | |
| % Turnover of Category workforce (b2) | 17.3% | 33.7% | 30.3% | 81.4% | 0.9% | 1.4% | 2.4% | 4.7% | 86.0% | |
| Total Workforce Turnover (a+b) | 454 | 910 | 747 | 2,111 | 48 | 36 | 59 | 143 | 2,254 | 100% |
| % Turnover total workforce | 5.6% | 11.2% | 9.2% | 26.0% | 0.6% | 0.4% | 0.7% | 1.8% | 27.7% | |
Notes:
a1, b1: % of Turnover Rate = (Cumulative number of voluntary departures during the year x 100) / Total workforce in respective employee age group category
a2, b2: % of Category turnover rate = (Number of voluntary departures x 100) / Total workforce in employee category
Learning and Development in FY 2025-26
Training Man Hours
| Training hours by employee category | Male (Age in years) | Female (Age in years) | Grand total | ||||||
|---|---|---|---|---|---|---|---|---|---|
| <30 | 30-50 | >50 | Total | <30 | 30-50 | >50 | Total | ||
| Top Management | 0 | 27.6 | 46.2 | 73.7 | 0 | 0 | 0 | 0 | 73.7 |
| Senior Management | 0 | 759.3 | 1,014.2 | 1,773.5 | 0 | 198.5 | 38.4 | 236.9 | 2,010.4 |
| Middle Management | 169.0 | 15,450.3 | 7,053.7 | 22,672.9 | 62.0 | 2,669.6 | 315.6 | 3,047.2 | 25,720.1 |
| Junior Management | 9,780.0 | 8,495.5 | 49.7 | 18,325.1 | 3,144.4 | 84.4 | 18.6 | 3,247.3 | 21,572.4 |
| Management Trainees | 21,906.5 | 57.5 | 0 | 21,964.0 | 5,495.9 | 0 | 0 | 5,495.9 | 27,459.9 |
| Average Training hours per Man-agement Level Workforce | 75.7 | 30.5 | 25.0 | 41.5 | 71.9 | 41.0 | 26.6 | 58.1 | 43.5 |
| Training hours of non-management categories | 5,725.3 | 2,436.9 | 244.5 | 8,406.6 | 3,352.4 | 0 | 0 | 3,352.4 | 11,759.0 |
| Average Training hours per Non-Management Level Workforce | 12.7 | 0.7 | 0.1 | 1.4 | 1,676.2 | 0 | 0 | 22.1 | 1.8 |
| Total Training hours | 37,580.7 | 27,227.0 | 8,408.2 | 73,215.9 | 12,054.7 | 2,952.5 | 372.6 | 15,379.8 | 88,595.6 |
| Average training hours per Work-force | 43.0 | 6.6 | 3.0 | 9.4 | 98.0 | 22.0 | 3.7 | 42.8 | 10.9 |
FTE is the Head count at the end of the reporting period i.e. as of March 31, 2026. The training hours provided here, are for total Workforce (India)
Diversity Indicators
Women’s Representation
| Share of Women | FY 2025-26 (no.) | % | FY 2025-26 (no.) | % | Targets | Denominator FY 2024-25 | Denominator FY 2025-26 |
|---|---|---|---|---|---|---|---|
| STEM-related roles | 239 | 6.83% | 186 | 8.4% | 7% | 3,497 | 2,222 |
| Management roles in revenue-generating functions | 68 | 10.91% | 83 | 10.0% | 11% | 623 | 834 |
| Top management roles, i.e. maximum two levels away from the CEO or comparable positions | 8 | 7.84% | 147 | 10.7% | 8% | 102 | 1,375 |
| Junior management roles | 155 | 17.38% | 98 | 14.1% | 20% | 892 | 696 |
| All management roles, including junior, middle and top management | 242 | 13.01% | 207 | 12.9% | 13% | 1,860 | 1,602 |
| In total permanent workforce | 362 | 8.37% | 181 | 11.3% | 9% | 4,327 | 1,602 |
Footnotes:
16 Specially-abled people in the workforce in FY 2025-26
Gender Pay Indicators for Employees and Workers1
Pay Quartiles by Gender2
| Period | Pay Quartiles | Upper [76% to 100%] |
Upper - Middle [50% to 75%] |
Lower - Middle [26% to 50%] |
Bottom [0% to 25%] |
|---|---|---|---|---|---|
| FY 2024-25 | % Female | 32.04% | 25.69% | 38.40% | 3.87% |
| % Male | 24.37% | 24.86% | 23.79% | 26.98% | |
| FY 2025-26 | % Female | 57% | 22% | 17% | 4% |
| % Male | 30% | 22% | 39% | 9% |
Human Capital Return of Investment3
| Particulars | FY 2021-22 | FY 2022-23 | FY 2023-24 | FY 2024-25 | FY 2025-26 |
|---|---|---|---|---|---|
| Total Revenue* ₹ crore (a) | 11,861.47 | 13,840.46 | 17,218.31 | 24,446.55 | 28,325.16 |
| Total Operating Expenses# ₹ crore (b) | 7,051.35 | 8,775.10 | 10,436.15 | 15,359.82 | 18,503.63 |
| Total Employee-related Expenses ₹ crore (c) | 885.07 | 986.65 | 951.70 | 1,032.94 | 1,092.64 |
| Human Capital Return of Investment = (a-b-c)/c | 6.43 | 6.13 | 8.13 | 9.80 | 9.99 |
Human Capital Return on Investment (HCROI) measures the financial value generated by a company’s workforce relative to the costs of employing them (salaries, benefits, training). A higher HCROI indicates better efficiency, typically calculated as, helping to evaluate profitability, engagement, and talent management strategies
*Total Revenue includes revenue from operations & other income but excludes income/expenses on account of movement in regulatory deferral account balance.
#Operating Expenses include the following expenses: Cost of Fuel, Cost of Power, Purchase of Stock-in-Trade, Employee Benefit Expense, Other Expenses.
1 WDI 5.2, WDI 5.3, WDI 5.4, WDI 5.6 CSA S&P 3.1.6 and WEF GRI 202-1
2 WDI 5.5, 5.7, 5.8, 5.9
3 CSA S&P 3.3.3