Progressing Our Environment and Climate Action Journey
Climate Adaptation and Mitigation
Resource Stewardship and Circular Resource Use
Water Stewardship and Efficiency
Biodiversity Conservation and Land Use Management
At Adani Energy Solutions, environmental responsibility is integrated into our daily operations and guides how we plan, operate and grow. As we expand and diversify, we remain committed to reducing our carbon & water footprint, protecting natural ecosystems and using resources responsibly. We are adopting advanced technologies, improving grid efficiency and integrating renewables to support India’s rising energy needs, while caring for the environment for future generations.
Through investments in decarbonisation, circular economy practices, ecosystem conservation and strong governance mechanisms, we strengthen operational sustainability while supporting India’s energy transition and environmental security.

Material Topics
Strategic Priorities
Capitals Impacted
 Natural Capital
 Financial Capital
 Social & Relationship Capital
 Intellectual Capital
 Manufactured Capital
 Human Capital
Key Risks and Opportunities
SDGs Aligned




84.2%
Reduction in Scope 1 & Scope 2 emissions (w.r.t. base year FY 2019-20)
72%
Decrease in Scope 3 emissions (w.r.t. base year FY 2020-21)
100%
Water positive operating sites
100%
Zero Waste to Landfill certified operational sites with waste diversion rate >99%
100%
Single use plastic free operating sites (certified by CII)
Environment Focus Areas
- Potential climate hazards that could impact the area or assets under consideration
- Physical
- Socioeconomic
- Environmental
- Coping Capacity
- Adaptive Capacity
- Workforce
- Business Segment
- Assets, sites, and operations
- Geographical area, Time period

Approach to Environment Management
Integrated Management System (IMS)
At Adani Energy Solutions, ecological responsibility is viewed not merely as compliance but as a strategic driver of innovation and responsible growth. It is deeply embedded in the leadership thinking and enterprise governance. Our environmental management is anchored in a robust Integrated Management System (IMS) that enables unified governance across operations and aligns environmental objectives with business strategy. The IMS supports consistent implementation of environmental controls and delivers value through streamlined processes, regulatory compliance and proactive risk mitigation, efficient resource utilisation, reliable data monitoring and transparent reporting. We stringently track, monitor and disclose our environmental performance against well-defined goals, targets and KPIs, using robust methodologies that align with global and national reporting frameworks.
Our Integrated Management System (IMS) is third-party assured and implemented across 100% of our operations and subsidiaries.
Read more ‘ESG Approach’ section on Pg. 142
Policy Framework
Our environmental strategy is operationalised through a well-defined framework of policies that translate intent into action. The Environment Policy promotes environmental stewardship, employee well-being, awareness, accountability, and continuous improvement across all levels of the organisation. It guides the Company’s approach to risk management, regulatory compliance, and workplace resilience. Our Board and its Corporate Risk Committee (CRC) oversee policy implementation across the operations and value chain. Policies are periodically reviewed and updated with stakeholder inputs, regulatory changes and internal assessments. This ensures that our policies remain relevant, responsive and forward-looking.
Environment Policy Read further
Climate Change Policy Read further
Biodiversity Policy Read further
Resource Management Policy
Controls and Integration Across Functions
We have built robust controls within our integrated management system (IMS) across the leadership and operations, for effective oversight and management of sustainability-related risks and opportunities. ESG KPIs are integrated into everyday departmental work, with standardised data systems that are led by the site-level ESG champions. The ESG mentors and the Chief Sustainability Officer conduct regular reviews. These multi-layer controls are woven into core internal functions, such as finance, legal, operations, and compliance for effective tracking, assurance and refinement of our sustainability performance. Further, continuous investment in advanced technologies, sustainable operational practices and research and development help us remain agile and future-ready.
Employee Training and Awareness
We build climate and ESG capacities of our workforce through internal and external training & awareness programmes.
100%
Directors and Senior Management made aware of climate change and ESG policies and procedures
98%
Employees received training on climate and ESG topics
Adani Energy Solutions has recorded zero environmental violations in the past four fiscal years and has incurred no significant fines or penalties (greater than USD 10,000) related to environmental or ecological concerns.
Phasing out of Dahanu Power Plant:
A key milestone in our decarbonisation roadmap
As a strategic decarbonisation strategy, we had set an aspirational goal to phase out coal from our power mix by 2030. We achieved it well ahead of the schedule through divestment of our sole thermal asset, Dahanu (ADTPS), effective September 26, 2024.
The Indian Scenario
As India charts its trajectory to becoming a USD 30 trillion economy by 2050, it also faces the dual challenge of sustaining rapid economic growth while also addressing the risks posed by climate change. Rapid urbanisation, industrialisation, and expanding access to electricity are driving the energy demand northwards. In this context, India’s transition to a resilient and reliable energy system is critical to achieve long-term development and socio-economic objectives.
India’s Climate Change Ambitions
The country has set clear ambitions under the Nationally Determined Contribution (NDC) aligned with the Paris Agreement to significantly reduce emissions from its economy. This includes becoming net zero by 2070, achieving 500 GW of non-fossil energy capacity, and sourcing 50% of its energy requirements from renewable energy by 2030. India also aims to reduce the emission intensity of its economy by 45% and create an additional carbon sink of 2.5 - 3.0 billion tonnes of CO2 equivalent through additional forest and tree cover. Complementing this, the National Green Hydrogen Mission seeks to position India as a global hub for green hydrogen production, targeting 5 million metric tonnes (MMT) of annual production by 2030. India is also making significant strides towards developing a domestic carbon market to encourage industries to adopt low-carbon technologies and trade carbon credits to reduce emissions across key sectors.
Adani Energy Solutions’ Net Zero 2050 Strategy: Aligned with Nation’s Sustainability Ambitions
At Adani Energy Solutions, our decarbonisation strategy closely aligns with these national priorities. As a leading enabler of India’s power infrastructure, we are strengthening Transmission and Distribution (T&D) networks by integrating renewable energy and deploying smart technologies to improve energy efficiency and reliability. Our strategic initiatives in smart metering, sustainable power procurement and innovative offerings such as Cooling as a Service, supports India’s clean energy transition and secure the energy needs of the growing economy. Our robust decarbonisation roadmap is in line with a 1.5°C pathway and aims at reducing our Scope 1, 2, and 3 emissions and achieving Net Zero by 2050.
Adani Energy Solutions integrates climate-related considerations into governance, risk management, and capital allocation. We actively engage with government bodies and investors to align on climate-related performance and priorities. Through resilient infrastructure, disciplined decarbonisation approach and transparent disclosures, we support India’s trajectory towards a secure, low carbon future.
Read further
Climate Change Policy
Scope 1 and Scope 2 GHG Reduction


Value Chain (Scope 3) GHG Reduction


Board and Management’s Oversight to Climate Risks and Strategy
The direction and strategic oversight to our ESG and climate agenda is led by the Board-level Corporate Responsibility Committee (CRC) comprising 100% independent directors. The CRC ensures that ESG and climate considerations are embedded into Adani Energy Solutions’ long-term strategy and operational decisions. The CRC is supported by the ESG Apex Committee, the Chief Sustainability Officer, the ESG Head, the cross-functional ESG Core Working Group and ESG champions at the site-level in driving implementation of the Board-led ESG and climate strategy across the organisation. This multi-tier governance ensures robust top-down oversight and effective bottom-up execution, translating sustainability strategy into action to achieve tangible outcomes.
Climate Risk Assessment and Scenario Analysis
We conducted comprehensive forward-looking climate risk assessment (2020–2039) covering our nationwide assets, facilities and tier 1 suppliers. The assessment evaluates the potential operational and financial impacts of climate change in line with the IFRS S2 framework. The analysis considers both physical and transition risks across short-, medium- and long-term time horizons, using globally recognised climate scenarios and pathways, including RCP 4.5 (SSP 2-4.5), RCP 6.0 (SSP 3-7.0), IEA 2DS, IEA B2DS and IEA NZE 2050. These scenarios helped assess infrastructure vulnerability, asset performance under climate stress and potential long-term financial implications that inform resilient operational and investment strategies.
The findings directly shape our long-term strategy, capital deployment and resource prioritisation. The identified risks and opportunities are systematically integrated into the Enterprise Risk Management (ERM) framework, enabling balanced trade-offs between financial performance, environmental responsibility and stakeholder expectations. Climate risk assessments are led by the Chief Sustainability Officer (CSO) and Head of Sustainability who also recommend mitigation actions to the relevant HOD’s of business functions and oversee their implementation along with the Chief Risk Officer (CRO).
To build accountability, we have linked a part of the remuneration for the Chief Executive Officer, Chief Sustainability Officer, Chief Purchase Officer, Managing Director’s and Business Unit Manager’s to ESG and climate-aligned Key Result Areas (KRAs) and performance metrics.
Implications for Strategy and Business Model
The climate resilience assessment helped understand how different climate scenarios could shape our strategy and business model.
Strategic Resilience and Direction
The Company evaluated the probable effects of various climate scenarios, including policy transitions, evolving market preferences, and physical climate risks. Findings indicate that our core strategy remained resilient under most plausible climate scenarios. However, in more challenging pathways, such as rapid decarbonisation or severe climate events signal the need to accelerate the adoption of low-carbon technologies and diversify revenue streams.
Business Model Adaptation
The climate scenario analysis has also informed potential adjustments to the business model. We are exploring opportunities to expand services in energy efficiency, renewable generation and infrastructure supporting climate adaption. We are also developing new capabilities and partnerships to address emerging customer demands and regulatory requirements.
Operational Adjustments
The analysis identified operational vulnerabilities, including supply chain disruptions, infrastructure exposure to extreme weather and changes in resource availability. In response, we are evaluating measures including operational redundancies, portfolio diversification and enhanced risk management processes to improve resilience and continuity.
Embedding Climate into Decisions
Physical and transition risks, along with broader sustainability risks, are embedded in strategic planning, operational decisions, and investment evaluations. A rigorous sustainability lens is applied to evaluating potential impacts, compliance requirements, and resilience considerations in the execution of major transactions, such as acquisitions, infrastructure development, asset modernisation and geographic expansion. Diversified operations across 16 states, robust grid modernisation, proactive climate governance, resilient asset design, with physical risks addressed at the design and planning phase, further reinforce our ability to navigate climate-related risks while delivering sustainable, long-term value.
To create a resilient, future-ready business model, Adani Energy Solutions leverages the findings from its climate risk assessment in the following ways:
ESG Considerations in Decision-making
- ESG considerations were integrated into Board-level oversight, capital allocation, and operational execution in FY 2025-26, with active reviews from the Corporate Responsibility Committee and ESG Apex Committee
- ESG-linked KPIs embedded in budgeting and forecasting processes
Capital Reallocation towards Low-carbon Growth
- Capex increased to ₹14,232 crore from ₹11,444 crore in FY 2024-25, prioritising green transmission corridors, smart metering infrastructure, and digital substations to support India’s energy transition
Strong Liquidity Supporting Transition
- Robust balance sheet with over ₹8,208 crore in cash and cash equivalents enables sustained investments in climate-resilient infrastructure
Portfolio Derisking from Transition Impact
- Strategic divestment of Dahanu Thermal Plant in FY 2024-25 reduces exposure to carbon pricing, regulatory tightening and transition risks, accelerating the shift to low-carbon operations
Digitalisation Driving Efficiency and Resilience
- Deployed 114 lakh (cumulative) Smart Meters in FY 2025-26 (versus the target of 100 lakh Smart Meter installation), enhancing operational efficiency demand side management and grid resilience
Robust Assurance and External Validation
- Externally assured sustainability disclosures, validated through strong ESG ratings from Sustainalytics, FTSE, S&P Global CSA CDP, ISS and WDI
Read further
Climate Transition Plan Report
Climate Adaptation and Mitigation Roadmap
At Adani Energy Solutions, our Net Zero 2050 roadmap is guided by science-based, time-bound targets, with clear interim milestones. We have implemented robust monitoring frameworks, strategic investments in clean technologies, and alignment with global climate disclosure standards. We are prioritising low-impact technologies, enhancing energy efficiency across the grid, and scaling renewable energy investments to restore environmental balance while addressing India’s energy needs.
1. Smart Metering: Advancing Low-Carbon Energy Transition
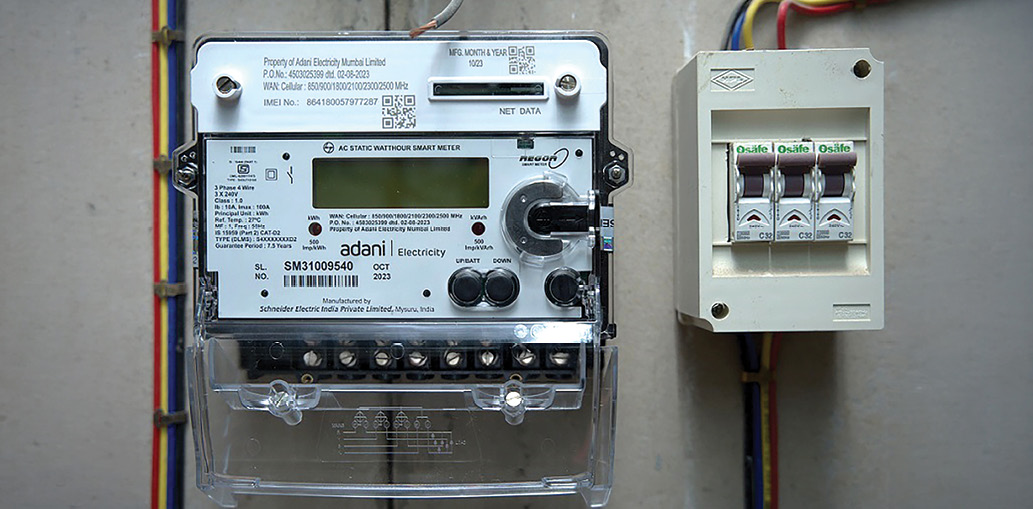
The Government of India’s Smart Meter National Programme, under the Revamped Distribution Sector Scheme (RDSS) aims to replace 5 crore conventional meters with smart meters by 2025-26. The programme aims to improve the quality, reliability, and affordability of power supplies, reducing AT&C loss to 12–15% and eliminating the ACS-ARR Gap by FY 2024-25. Adani Energy Solutions views smart metering not only as a high-growth opportunity of ₹272 billion in India but also as a key driver of demand side efficiency and grid decarbonisation.
Integrated Delivery Model
As a service partner to distribution companies, Adani Energy Solutions will provide end-to-end smart metering under the Design-Build-Finance-Own-Operate-Transfer (DBFOOT) model that will cover meter hardware, communication networks, cloud infrastructure and data management systems. Building on operational expertise from the distribution business in Mumbai & Mundra, the Company is evolving from a service provider into an integrated digital energy solutions platform.
Smart metering enables lower losses, smarter consumption and digital grid operations, making it a scalable pathway to energy efficiency, demand side management, financial stability and decarbonisation across India’s power sector.
| Value for Consumers | Value Distribution Companies |
|---|---|
| Real-time electricity consumption monitoring | Elimination of manual meter reading |
| Time-of-day tariff and usage optimisation | Reduction in AT&C losses and downtime |
| Accurate meter reading and transparent billing | Electricity theft detection |
| Power outage alerts | Digital grid management, energy audit & predictive maintenance |
| Pay bills from anywhere & anytime | Improved financial health through higher collection efficiency and financial |
Progress Snapshot
| Particulars | FY 2024-25 | FY 2025-26 | Target |
|---|---|---|---|
| Smart meters installed (cumulative) | 31 lakh | 114 lakh | 100 lakh |
| Investment incurred | ₹ 20 billion | ₹ 65 billion | ₹ 65 billion |
| States covered | 5 | 6 | 5 |
| Market share | ~17% | ~18% | ~18% |
2. Internal Carbon Price (ICP)
Adani Energy Solutions has implemented an internal carbon pricing mechanism that incorporates GHG emissions costs into business decisions and capital allocation, with a benchmark of ₹ 800 per tCO2e and a Shadow price of ₹ 12,488 per tCO2e. These price reflects both the cost of abatement in the Company’s operational context and provides a forward-looking reference for evaluating future projects.
The ICP is:
- Implemented across all business units for consistent and comparable carbon-related financial evaluation
- Applied to all capital investments, particularly for emission-intensive projects, through stress testing and scenario analysis
- Used a separate shadow price to guide supply chain and procurement strategies towards low-carbon alternatives and supplier engagement
- Applied to assess operational efficiency and emission reduction initiatives to optimise impact and resource deployment
The ICP is governed by an internal committee with representatives from sustainability, finance, risk, and strategy that oversees the pricing methodology, periodic reviews, and implementation across the Company. The ICP is periodically recalibrated with feedback from the cross-functional teams, sustainability experts and external advisors and supported by independent third-party assurance. This approach maintains accountability, transparency and consistency with evolving regulatory expectations, carbon markets and leading sustainability frameworks.
| GHG Scope | Type of ICP | Set Price | Actual Price | Price Setting Approach |
|---|---|---|---|---|
| Scope 1, 2 & 3 | Implicit Carbon price | ₹ 800 per MtCO2e | ₹ 4,665 per MtCO2e | Implicit price approach, informed by prevailing carbon market prices & regulatory trends, peer benchmarking and global best practices |
| Scope 3 | Shadow pricing | ₹ 12,488 per MtCO2e | ₹ 12,488 per MtCO2e | Notional cost that would be incurred to meet the Regulator and or Voluntary commitment guiding optimal grid infra usage |
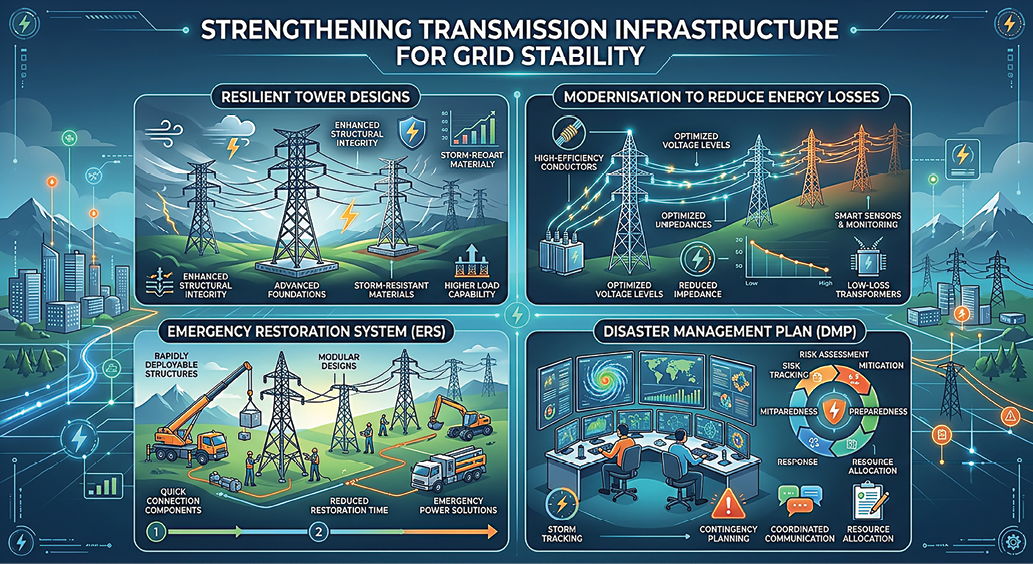
3. Strengthening Transmission Infrastructure for Grid Stability
Resilient Tower Designs
Robust and cost-efficient tower infrastructure is the backbone of our expanding transmission footprint across India. We combine conventional engineering with innovative designs to enhance network reliability and resilience. Our tower structures are designed to withstand diverse environmental conditions, including wind and seismic activities, soil resistivity, water characteristics, hydrological studies, etc.
Modernisation to Reduce Energy Losses
We continue to upgrade our transmission and distribution network through improved design, advanced technologies and regular enhancements to limit energy losses, including the ones linked to rising temperatures and enhance network efficiency and long-term competitiveness.
Emergency Restoration System (ERS)
Our Emergency Restoration System supports swift recovery post disruptions, backed by continuous monitoring and a skilled workforce. The system allows rapid restoration and quick erection of lightweight structures within 3-15 days, with periodic mock drills conducted to gauge effectiveness.
Disaster Management Plan (DMP)
AEML’s robust Disaster Management Plan for its Transmission and Distribution network is guided by the Sendai Framework for Disaster Risk Reduction (Sendai, Japan, 2015), UN Sustainable Development Goals (2015) and Climate Change Agreement (COP21, 2015), and the Prime Minister’s Agenda for Disaster Risk Reduction. It addresses network vulnerabilities to natural and manmade disasters and outlines structured mitigation, response and processes, recovery plans, with clearly defined roles and responsibilities across the organisation.
4. Climate Policy Advocacy
We actively engage with the government bodies, industry associations, and international organisations to help shape climate responsive public policies. Our advocacy efforts and lobbying activities focus on renewable energy, energy efficiency, and sustainable power systems and remain aligned with the Paris Agreement. Our policy position supports the adoption of smart grid technologies, decentralised energy solutions, electric vehicle infrastructure, and demand side management programmes, strengthening the transition to low carbon economy. Engagements through sectoral forums and partnerships enable constructive dialogue, regulatory feedback, and collaborative advocacy. Before engaging with any trade association, we conduct due diligence to ensure its policy positions, agenda and activities are consistent with the principles of the Paris Agreement.
As a signatory to IRENA Utilities for Net Zero Alliance, the UN Energy Compact, and adopters & supporter of the United Nations Global Compact (UNGC) principles, Science Based Targets Initiatives [SBTi], we contribute to global climate discussions and align our initiatives on renewable integration, demand-side efficiency, grid modernisation, and sustainable finance with international best practices.
0.7 gigawatts
of clean energy contributed to the national grid through our clean energy projects
Measurable gains achieved
in energy efficiency, cost optimisation and grid stability, strengthening long-term sustainability and returns

Adani Energy Solutions became the 1st Indian Electric Utility to commit to Utilities for Net Zero Alliance, uniting global utilities and power companies to develop renewable energy grids, promote clean energy solutions and advance electrification. This collaboration enables Adani Energy Solutions to leverage experience of its global peers, while sharing insights on building high-capacity renewable energy evacuation networks.
5. Increasing the Share of Renewable Energy in the Power Mix

*Target - 30%
^This includes 3,224.23 MUs procured (equivalent to 28.38%) for past period RPO compliance as per MERC.
Year-on-Year Scope 3-Category Emissions Avoided
| UoM | FY 2018-19 Base year | FY 2021-22 | FY 2022-23 | FY 2023-24 | FY 2024-25 | FY 2025-26 |
|---|---|---|---|---|---|---|
| MtCO2e p.a. | 2,30,199 | 5,09,056 | 19,49,113 | 26,56,987 | 29,09,293 | 53,15,937 |
| Lakh Indians* | 1 | 2 | 9 | 12 | 13 | 24.16 |
*Considering 2025: India’s GHG emissions per capita = 2.2 MtCO2e
We prioritise the integration of solar, wind and other sustainable sources into the grid to reduce fossil fuel dependence and support a diversified power mix for India. Simultaneously, we are investing in storage solutions, such as batteries and pumped hydro storage, to manage intermittency and ensure grid stability and reliability. The Company made a revenue of ₹ 5,256.01 crore in FY 2025-26 from its renewable energy distribution.
Progress Made till FY 2025-26
- 3.3 MW in-house solar PV projects capacity achieved, up from 1.7 MW in FY 2019-20, within the operational boundaries
- 700 MW long-term wind-solar hybrid PPA secured for 25 years to provide clean energy
- Planned expansion of renewable energy capacity with an additional 1,500 MW RE PPA and short-term RE PPA’s underway
- 1,500 MW additional RE PPA planned, with short-term RE PPAs under execution
- Solar power and RE-Green tariff deployed to offset auxiliary consumption
- 75 MWh Battery Energy Storage Systems [BESS] planned to support RE integration
Adani Energy Solutions remain firmly committed to sustainable power procurement and advancing the clean energy transition, with no plans to add new thermal power capacity in future.
Electricity Generation and Capacity Mix
| Particulars | Capacity Mix (MW) | Gross Generation (GWh) |
|---|---|---|
| Conventional Energy | ZERO | 7,094 |
| Other Non-Conventional Energy | 3.3 | 1,285 |
| Wind and Solar Hybrid | 700 | 2,979 |
| Smart Grid Infrastructure [Smart meters + transmission lines] | 1.14 crore Smart meters | — |
| Particulars | Sustainable Revenue ₹ crore | % of total Revenue | Total Revenues ₹ crore |
|---|---|---|---|
| FY 2021-22 | 1.86 | 0.02% | 11,861.47 |
| FY 2022-23 | 2.01 | 0.01% | 13,840.46 |
| FY 2023-24 | 3.62 | 0.02% | 17,218.31 |
| FY 2024-25 | 6,279.07 | 25.68% | 24,446.55 |
| FY 2025-26 | 8,446.56 | 35.10% | 28,325.16 |
6. Green Finance to Advance Decarbonisation Agenda
Sustainability-Linked Bonds (SLBs)
Harnessing the power of the debt markets in providing sustainable finance, AEML, the retail division of Adani Energy Solutions, has raised capital through Sustainability-Linked Bonds (SLBs) in line with its ESG commitments. The selected SLB KPIs are closely linked to the Company’s sustainability priorities and support the United Nations Sustainable Development Goals (SDGs).
Key Components of Sustainability-Linked Bonds (SLBs)

KPIs for SLB

| KPI | Target | Performance in FY 2025-26 |
|---|---|---|
| Increase in Renewable Power Mix | 60% by FY 2026-27 | 37.53% (without REC’s) achieved 65.92% (with REC’s) achieved |
| Reduction in GHG Emission Intensity per EBITDA (Scope 1 & 2, AEML Retail division) | 40% by FY 2024-25 50% by FY 2026-27 60% by FY 2028-29 (Baseline: FY 2018-19) | 91.26% (without REC’s) achieved |
Commitment Towards Global Climate Action
AEML – RE% in Procurement Mix

^This includes 3,224.23 MUs procured (equivalent to 28.38%) for past period RPO compliance as per MERC
Target Achieved (without REC’s):
of FY 2022-23 target
of FY 2026-27 target
of FY 2029-30 target
AEML - GHG Emission Intensity / EBITDA (Scope 1 + 2) [tCO2e / ₹ crore]

Target Achieved:
of FY 2024-25 target
of FY 2026-27 target
of FY 2028-29 target
Debt Repurchase
As of late 2025, AEML has repurchased and cancelled approximately USD 44.66 million of its USD 300 million senior secured SLB notes due 2031.
Progress on Sustainability Targets (SPTs):
With 65.92%^ Renewable Energy share in the power mix and 91.26% reduction in the AEML’s GHG emission intensity in FY 2025-26 (AEML), the Company is on track to meet its established sustainability targets.
Rating Affirmation
Fitch Ratings has affirmed ‘BBB-’ ratings on AEML’s senior secured notes and revised the outlook to stable in early 2025.
Bond Characteristics
The SLBs include a clause where a failure to meet predefined sustainability targets (KPIs) can trigger a 0.15% per annum interest rate step-up for each failed KPI.
Key Takeaways: AEML is proactively managing its debt, with bond repurchases improving the balance sheet, while simultaneously staying ahead of its sustainability performance targets, making the likelihood of the penalty interest rate trigger low.
Green Loans
Adani Energy Solutions raised a USD 700 million revolving loan facility, which was designated as a ‘Green Loan’ by Sustainalytics. The funds will be deployed towards eligible green projects to support clean energy integration and grid resilience for strengthening India’s energy landscape.
An independent Second Party Opinion (SPO) from Sustainalytics assured the loan’s adherence to the green loan framework, which validates the Company’s alignment with sustainability principles, risk management practices, and responsible allocation of funds.
This revolving loan facility supports priority projects in Gujarat and Maharashtra, including:
- Government of India’s Green Energy Corridor (GEC) projects in Gujarat, facilitating the evacuation and transmission of renewable energy
- Transmission System projects in Mumbai, enhancing grid stability and reliability
7. Reducing Greenhouse Gas Emissions
We have established science-based long-term and interim targets to reduce our GHG footprint, in line with global climate goals, with a heightened focus on value chain emissions. We engage suppliers through a structured due diligence framework and capacity building programmes, encouraging practical, scalable solutions to shared sustainability challenges.
53,15,937 tCO2e
of clean energy contributed to the national grid through our clean energy projects
Our Collaborative Approach for Value Chain Decarbonisation Includes:
100%
new vendors screened on pre-determined ESG criteria, embedding responsible sourcing practices right at the start of the business relationship
100%
significant suppliers assessed during the year for ESG performance
~68%
by spends value suppliers engaged
33.4%
by spends value suppliers have set their Net Zero target aligned with SBTi
64.9%
by spends value suppliers have set their emission/water reduction target other than SBTi
15%
by spends value suppliers engage with their supply chains [i.e. Adani Energy Solutions Tier-2,3 suppliers]
GHG Emissions Profile in FY 2025-26 (in MtCO2e)
| Particulars | FY 2021-22 | FY 2022-23 | FY 2023-24 | FY 2024-25* | FY 2025-26* | FY 2025-26 Target |
|---|---|---|---|---|---|---|
| Gross Scope 1 GHG emissions* (Gases covered: CO2, CH4, N2O, SF6, CFCs) | 26,92,062 | 28,26,371 | 26,63,319 | 13,40,619 | 14,473 | 55,178 |
| Gross Scope 2 GHG emissions (Market-based) (Gases covered: CO2) | 5,57,775 | 4,35,852 | 4,26,436 | 4,22,206 | 4,93,273 | 4,98,059 |
| Gross Scope 2 GHG emissions (Location-based) (Gases covered: CO2) | 5,58,915 | 4,38,291 | 4,33,825 | 4,33,133 | 5,13,175 | — |
| Gross Scope 3 GHG emissions** (Gases covered: CO2, CH4, N2O, SF6, CFCs) | 40,89,587 | 31,17,794 | 54,86,805 | 21,64,885 | 10,63,112 | 19,48,397 |
*Decrease in GHG emissions at Adani Energy Solutions can be primarily attributed to the divestment of the Adani Dahanu Thermal Power Station (ADTPS), effective from September 26, 2024.
**The primary cause of decrease of emissions can be attributed to the improved procurement practices and reduced transmission and distribution losses.
GHG Emissions Intensity (Scope 1 & 2)
GHG Emissions Intensity
(MtCO2e/ revenue in million ₹)

GHG Emissions Intensity
(MtCO2e/ GWh Electricity sold)

GHG Emissions Intensity (MtCO2e/ revenue in million ₹)
| Particulars | FY 2020-21 | FY 2021-22 | FY 2022-23 | FY 2023-24 | FY 2024-25 | FY 2025-26 |
|---|---|---|---|---|---|---|
| Scope 1+2 Emission Intensity (MtCO2e/ million ₹ revenue) | 30.72 | 27.39 | 23.57 | 17.94 | 7.21 | 1.79 |
| Scope 1+2 Emission Intensity BAU (MtCO2e/ million ₹ revenue) | 30.72 | 27.39 | 23.57 | 17.94 | 14.28 | 13.48 |
The decrease in GHG intensity at Adani Energy Solutions can be primarily attributed to the divestment of the Adani Dahanu Thermal Power Station (ADTPS), effective from September 26, 2024. This structural change, combined with rise in overall revenue, contributed to the observed reduction in (Scope 1+Scope 2) emissions intensity.
System Availability and Efficiency
System availability and efficiency improved, with 99.7% transmission uptime and 4.46% distribution loss.
| Particulars | FY 2021-22 | FY 2022-23 | FY 2023-24 | FY 2024-25 | FY 2025-26 |
|---|---|---|---|---|---|
| Plant capacity (MW) | 503.36 | 1,203.36 | 1,203.36 | 1,203.36 | 703.36 |
| RE Plant capacity (MW) | 3.36 | 703.36 | 703.36 | 703.36 | 703.36 |
| Thermal Plant capacity (MW) | 500 | 500 | 500 | 500 | 0 |
| Availability Factor of Plants (%) | 98.07 | 90.75 | 95.82 | 97.28 | 0 |
| Thermal Plant load factor (%) | 73.2 | 76.21 | 79.88 | 84.7 | 0 |
| Thermal Plant Heat Rate (BTU/kWh) | 8.966 | 8,982 | 9.010 | 9,011 | 0 |
| Thermal Plant Gross Generation (million kWh) | 3,008.92 | 3,498.92 | 3,498.92 | 1,658.94 | 0 |
* w.e.f. September 26, 2024-500 MW Dahanu Thermal Power Plant carved out and divested.
GHG Emissions Associated with Power Delivery
| Particulars | FY 2020-21 | FY 2021-22 | FY 2022-23 | FY 2023-24 | FY 2024-25 | FY 2025-26 |
|---|---|---|---|---|---|---|
| Gross direct GHG emissions (MtCO2e/ GWh sold) (CO2, CH4, N2O, SF6, CFCs) | 0.33 | 0.41 | 0.36 | 0.31 | 0.17 | 0.04 |
| Gross direct GHG emissions (MtCO2e/ GWh sold) (CO2, CH4, N2O, SF6, CFCs) BAU | 0.33 | 0.41 | 0.36 | 0.31 | 0.34 | 0.32 |
Category-Wise Scope 3 Emissions [MtCO2e]
| Emission Category | FY 2019-20 | FY 2020-21 | FY 2021-22 | FY 2022-23 | FY 2023-24 | FY 2024-25 | FY 2025-26 | |
|---|---|---|---|---|---|---|---|---|
| Gross Scope 3 GHG emissions (CO2, CH4, N2O, SF6, CFCs) | 53,56,636 | 37,63,610 | 40,89,587 | 31,17,794 | 54,86,805 | 21,64,885 | 10,63,112 | |
| 1 | Purchased goods and services | 52,93,661 | 37,19,364 | 40,41,508 | 6,67,124 | 11,87,106 | 1,66,907 | 3,00,346 |
| 2 | Capital goods | 4,16,952 | 7,41,941 | 5,41,882 | 3,82,298 | |||
| 3 | Fuel-and-energy related activities | 19,97,064 | 35,53,651 | 14,25,101 | 3,43,014 | |||
| 4 | Upstream transportation and distribution | 62,538 | 43,940 | 47,746 | 36,400 | 3,585 | 26,757 | 28,728 |
| 5 | Waste generated in Operations | 89 | 63 | 68 | 52 | 51 | 21 | 66 |
| 6 | Business travel | 326 | 229 | 249 | 190 | 399 | 1,070 | 582 |
| 7 | Employee commute | 21 | 14 | 16 | 12 | 72 | 2,954 | 8,078 |
| 8 | Upstream leased assets | 0 | 0 | 0 | 0 | 0 | 0 | 0 |
| 9 | Downstream transportation and distribution | 0 | 0 | 0 | 0 | 0 | 0 | 0 |
| 10 | Processing of sold products | 0 | 0 | 0 | 0 | 0 | 0 | 0 |
| 11 | Use of sold products | 0 | 0 | 0 | 0 | 0 | 0 | 0 |
| 12 | End-of-life treatment of sold products | 0 | 0 | 0 | 0 | 0 | 0 | 0 |
| 13 | Downstream leased assets | 0 | 0 | 0 | 0 | 0 | 0 | 0 |
| 14 | Franchises | 0 | 0 | 0 | 0 | 0 | 0 | 0 |
| 15 | Investments | 0 | 0 | 0 | 0 | 0 | 0 | 0 |
| Other (upstream & downstream) | 0 | 0 | 0 | 0 | 0 | 0 | 0 |
| Category | Emission Calculation Methodology |
|---|---|
| Purchased goods and services | Spend-based method was used, where the spend data for different commodities purchased is taken as an input for the activity data. |
| Capital goods | Emission factors for this category were referred from US EPA’s Supply Chain Greenhouse Gas Emission Factors v1.2 by NAICS-6 dataset adjusted for Inflation in India context. |
| Fuel-and-energy related activities | T&D losses occurring in the grid for the consumed electricity and emissions due to extraction, production, and transportation of fuels consumed by the organisation. Plus, emissions accounted from the generation of purchased energy. Central Electricity Authority (CEA) of India published emissions factors and declared T&D Losses. |
| Upstream transportation and distribution | Hybrid method was used to consolidate emissions in this category. Supplier-specific method was adopted for road transport, in which the fuel consumed was taken as input data point. For transportation through other modes such as train, sea and air, distance travelled has been taken as the activity data. Emission Factors for this category were referred from DEFRA Jun 2025 and IPCC. |
| Waste generated in operations | Emissions in this category stem from disposal in a landfill, recovery for recycling, incineration, composting, wastewater treatment. Emission factors for specific waste types and waste treatment methods were used from DEFRA Jun 2025. We have diverted 99.99% of waste from landfill and are certified as Zero waste to landfill by M/s Intertek Private Limited for O&M sites, & grid division, and by M/s BVCI for electricity retail division. |
| Business travel | Distance-based data for air, rail and road mode was selected as data input. We refer secondary references to identify the context-specific emission factor. ICAO Carbon Air Emissions Calculator - Passenger, Road, and Rail emissions factor from India GHG protocol. |
| Employee commute | Average data method based on survey responses received from employees. Data inputs include mode of travel, fuel and distance. Referred DEFRA Jun 2025 and GHG Protocol mobile combustion guidance for determining the emission factors. |
| Upstream leased assets | No upstream leased assets other than logistics vehicles which are already accounted under Scope 1 as fuel used is paid by Adani Energy Solutions, thus emissions under this category are 0 for the reporting period |
| Downstream transportation and distribution | No downstream leased assets other than customer care offices and logistics vehicles used for the distribution & transmission line inspection, O&M & Smart metering teams, which are already accounted under Scope 1 and electricity consumption under Scope 2, as Energy used is paid by Adani Energy Solutions, thus emissions under this category are 0 for the reporting period. |
| Processing of sold products | No processing required for use of our Product & services and thus, emissions under this category is reported 0. |
| Use of sold products | No additional energy required for use of our products and services, thus reported 0. |
| End-of-life treatment of sold products |
|
| Downstream leased assets | Downstream leased assets for customer care centres of the retail electricity division & smart-metering system warehouses are included in Scope 2; hence this category of emissions is reported 0. |
| Franchises | No franchises for our products & services, therefore disclosed as 0. |
| Investments | Investments made in other entities where we don’t have operational control, hence emissions under this category are not relevant for tracking and monitoring, thus disclosed as 0. |
| Other (upstream & downstream) | We do not track activity data under this category as we believe the relevant Scope 3 emissions are already covered in the specific categories, thus reported 0. |
8. Managing Air Emissions
We conduct online monitoring of emission levels of SO2, NOx, and TPM in Flue gas. We use IPCC as the source of emissions factors and calculate air emissions using the GHG protocol. ODS Management: Strict protocols for safe handling and disposal of ozone-depleting substances to minimise environmental harm.
| Type of air emissions | Unit | FY 2021-22 | FY 2022-23 | FY 2023-24 | FY 2024-25* | FY 2025-26# |
|---|---|---|---|---|---|---|
| Direct NOx emissions | MT | 3,571.6 | 4,035.1 | 3,742.7 | 1,769.5 | 48.59 |
| Direct SOx emissions | MT | 2,106.4 | 2,909.2 | 3,088.7 | 1,607.3 | 8.35 |
| Dust [TPM] emitted | MT | 454.0 | 540.0 | 539.7 | 280 | 1.25 |
| Mercury emissions | Kg | 26.5 | 29.3 | 27.2 | 14.45 | 0 |
| SF6 emissions | Kg | 31.7 | 125.2 | 58.75 | 32.48 | 0.25 |
| Ozone-Depleting Substances emitted* | Kg of CFC11Eq | 22.2 | 0 | 0 | 0 | 0 |
*ODS emissions include R22, R410A and SF6 and are not considered in the data above as their ODP is zero, although they are emitted.
NOx, SOx, SF6 Emissions (MtCO2e) are included in our overall Scope 1 emissions.
#The decrease in air emissions at Adani Energy Solutions can be primarily attributed to the divestment of the Adani Dahanu Thermal Power Station (ADTPS), effective from September 26, 2024.
Read more in BRSR-principle 6 on Pg. 470
9. Efficiency in Energy Management
Our Approach
Our enterprise-wide energy management framework focuses on energy efficiency, assurance and optimisation. This is supported by robust policies and ISO-50001 compliant energy management systems across operations. Defined energy saving targets linked to the operational plans guide focussed reduction initiatives, with periodic progress reviews. Employee training programmes promote energy-conscious behaviour. We also invest in research and innovation to reduce energy demand and improve operational efficiency. To support decarbonisation, we are actively increasing the use of clean energy, including solar and wind, and adopting a hybrid Wind-Solar model to maximise resource utilisation.
Major Conservation Initiatives in FY 2025-26
- Load optimisation to lower auxiliary power consumption
- Optimised diesel consumption in the DG set
- SF6 (Sulphur Hexafloride) gas leak detection using advanced cameras
- Energy-efficient equipment
- Nano molecular thermos conductive additive treatment for air conditioning system
29.9%
reduction in energy consumption (since baseline FY 2021-22)
8,99,217 GJ
since FY 2021-22 &
1,98,132 GJ YOY
reduction in total energy consumption and 1,77,346 MtCO2 since FY 2021-22 & 39,076 MtCO2 YOY MtCO2e reduction in GHG emissions achieved through targeted conservation and efficiency initiatives. The reductions cover fuel, electricity, and energy for heating, cooling, and steam generation. The calculation was aligned with the GHG Protocol methodology, ensuring consistency with global standards.
Energy Consumption in FY 2025-26 (in GJ)
| Type of energy | FY 2021-22 | FY 2022-23 | FY 2023-24 | FY 2024-25* | FY 2025-26* |
|---|---|---|---|---|---|
| (A) Coal | 3,15,55,809 | 3,28,11,389 | 3,18,01,563 | 1,80,64,515 | 0 |
| (B) Diesel | 28,443 | 38,984 | 31,745 | 23,951 | 1,48,054 |
| (C) Light Diesel Oil [LDO] | 13,455 | 10,208 | 20,518 | 9,116 | 0 |
| (D) Liquefied Petroleum Gas [LPG] | 625 | 653 | 643 | 318 | 0 |
| (E) Petrol | 4,675 | 4,620 | 3,166 | 6,100 | 25,775 |
| Total (F) = A+B+C+D+E | 3,16,03,007 | 3,28,65,854 | 3,18,57,636 | 1,81,04,000 | 1,92,405 |
| (G) Electricity consumed from non-RE sources | 80,422 | 99,649 | 1,07,546 | 78,984 | 10,19,886 |
| (H) Electricity consumed from RE sources (H) | 5,065 | 12,368 | 8,760 | 20,906 | 18,53,511 |
| (I) Total Energy Consumed I = F+G+H | 3,16,88,494 | 3,29,77,871 | 3,19,73,942 | 1,82,03,890 | 30,65,801 |
| Electricity Sold (in GJ) | 2,86,99,200 | 3,26,23,200 | 3,56,97,600 | 3,80,08,800 | 3,81,02,400 |
| Total Energy Consumption within the Organisation | 3,45,92,301 | 36,41,256 | 2,81,33,978 | 2,02,36,245 | 30,65,801 |
| Total Energy Consumption Outside the Organisation | 2,92,37,796 | 4,17,27,703 | 2,72,02,371 | 1,77,72,555 | 3,81,02,400 |
Note: Adani Energy Solutions doesn’t consume energy from any renewable fuel source, hence the same has not been reported.
Energy Intensity
| Particulars | FY 2019-20 | FY 2020-21 | FY 2021-22 | FY 2022-23 | FY 2023-24 | FY 2024-25* | FY 2025-26* | Reduction Target |
|---|---|---|---|---|---|---|---|---|
| GJ/revenue in Mn ₹ | 481.30 | 292.30 | 267.16 | 238.27 | 197.63 | 82.87 | 10.82 | 50% by FY 2026-27 70% by FY 2029-30 |
| GJ/MWh sold | 2.14 | 3.43 | 3.97 | 3.64 | 3.43 | 1.92 | 0.29 | — |
*Decrease in energy intensity could be attributed to divestment of Adani Dahanu Thermal Power Station [ADTPS] effective September 26, 2024, and the increase in revenue. This contributed to the observed reduction in the energy intensity.
96%
reduction in energy intensity since the base year FY 2019-20
Reduction in Energy Requirements of Products and Services in FY 2025-26 compared to FY2024-25
Energy Efficiency for Customers Through Demand Side Management Initiatives
Smart metering, consumer awareness programmes, and promotion of energy efficient 5-star rated appliances help bring down peak load and overall consumption
Impact: 5,040 GJ energy saved and 1,008 MtCO2e emissions avoided in FY 2025-26
Transmission Loss Reduction for Network Efficiency
Deployment of advanced grid technologies, high-efficiency conductors, and real-time monitoring reduces technical losses across transmission networks.
Impact: 80,015 GJ energy saved and 15,781 MtCO2e emissions avoided
Distribution Loss Reduction for Operational Efficiency
Network audits, infrastructure upgrades, and targeted loss detection programmes minimise technical and commercial losses across distribution systems.
Impact: 1,18,117 GJ energy saved and 23,295 MtCO2e emissions avoided
10. Smart Grid Technology and Demand Side Management
Energy Affordability Aligned with ESG Objectives


End use efficiency and demand side management are critical to building a low carbon, resource-efficient power system to lower overall demand, improve grid performance and reduce environmental impact, while creating long-term value for customers and communities. With 100% smart grid integration across its electric load, the Company enables seamless operations and improved end use efficiency.
We have integrated demand side management strategy across operations and stakeholder management. We ensure compliance with energy efficiency standards, and conduct various demand side management programmes in partnership with regulators, suppliers and customers. Our efforts in demand side management are embedded across internal operations through product innovation, compliance management and supplier audits, engagement with policymakers and transparent regulatory dialogues. Various demand side initiatives have delivered estimated customer electricity savings of 1.4 MU’s across markets. The Company tracks key indicators such as renewable energy share, green tariff uptake and participation in efficiency programmes, enabling continuous improvement.
Key Initiatives to Support Customers in Adopting Sustainable Technologies
- Promotion of energy-efficient appliances, including 5-star rated products
- Deployment of smart grids and smart meters for real-time monitoring and informed consumption
- Implementation of resource efficiency measures, such as zero liquid discharge systems and water reuse systems
- Expansion of transmission infrastructure to integrate renewable energy and enable access to low carbon power
Sustainable Mobility and Innovation
The Company had invested ₹ 2.6 crore across 16 O&M sites to deploy over 3,400 EV charging points across 22 states and 4 Union Territories, to support transition to low carbon mobility during FY 2024-25. Customers’ access is further enhanced through strategic partnerships and investments in innovations in the field of sustainable energy and mobility solutions.
Monitoring Performance
We have set clear indicators, such as energy efficiency compliance rates, customer satisfaction, emission reduction, operational cost savings and investments in efficient technologies to track effectiveness. We ensure programme responsiveness to emerging regulatory and customer expectations through regular reviews and market assessments.
Community and Circularity
We engage with communities, academic institutions and environmental experts to promote circular economy principles into project planning and execution. Our initiatives focused on community-based energy trading platforms improve local energy resilience and promote decentralised renewable energy access.
11. Minimising Grid Losses and Enhancing Reliability
We view grid resilience as a strategic capability crucial for enabling reliable power supply, operational excellence and long-term value creation. It is critical in supporting market expansion, strengthening customer trust and minimising emissions at the source.
Ensuring Reliability and Service Continuity
- Predictive maintenance, real-time network monitoring and structured customer communication
- Rapid response mechanisms and coordinated stakeholder engagement for swift restoration in case of disruptions
Performance and Oversight Mechanism
- Well-defined KPIs and targets, including outage frequency, restoration time, and customer satisfaction metrics
- Systematic evaluation of performance, with insights integrated into operations
- The calculation for line losses in the grid performed in accordance with the GHG Protocol Methodology, ensuring standardised and reliable reporting of energy performance
Enabling Low Carbon Power
- We develop and operate grid infrastructure that enables low-carbon and renewable electricity, in line with European Union (EU) Taxonomy
- Our activities include the development and expansion of direct connections between electricity generation sources emitting below 100 gCO2e/kWh on a life cycle basis and substations or transmission networks
| FY 2021-22 | FY 2022-23 | FY 2023-24 | FY 2024-25* | FY 2025-26* | |
|---|---|---|---|---|---|
| Grid losses | |||||
| Transmission losses (%) | 1.35 | 1.41 | 1.56 | 1.29 | 1.13% |
| Distribution losses (%) | 6.55 | 5.93 | 5.29 | 4.77 | 4.21% |
| Grid reliability | |||||
| System Average Interruption Duration Index (SAIDI). Minutes per consumer per year | 23.63 | 22.35 | 21.26 | 21.27 | 12.91 |
| System Average Interruption Frequency Index (SAIFI). Events per consumer per year | 0.82 | 0.70 | 0.69 | 0.67 | 0.42 |
| Customer Average Interruption Duration Index (CAIDI) Minutes per event | 28.95 | 31.74 | 30.63 | 31.58 | 30.82 |
*In FY 2025-26, the Company reported 19% line losses Reduction in the grid that resulted in a reduction in energy requirements for sold products and services, with FY 2023-24 used as the baseline.
The calculation was performed in accordance with the GHG Protocol Methodology, ensuring consistency, comparability and reliability of energy performance disclosures.

Circular Approach
At Adani Energy Solutions, we adopt a lifecycle-based approach to waste management that integrates circular economy principles across design, procurement, operations and end use. We prioritise waste prevention, recovery and responsible disposal to minimise environmental risks and landfill dependency. We apply the 5R Framework (Refuse – Reduce – Reuse – Recycle / Repurpose – Recover) across the lifecycle covering upstream, operations and downstream. Circularity considerations are embedded at the planning and design stage of the projects. Material optimisation, modular construction practices and responsible sourcing frameworks reduce generation at source and enhance waste efficiency.
99.8%
Waste diverted from landfills through reuse and recycling
Recycling programmes are integrated into operations and targeted training programmes are delivered to employees to promote responsible waste management practices.
Controls and Compliance
We rigorously follow the regulations issued by the Ministry of Environment, Forest and Climate Change (MoEF&CC) and the Central Pollution Control Board (CPCB), such as the Hazardous and Other Wastes (Management and Transboundary Movement) Rules, 2016. Our compliance mechanism include:
- Responsible waste disposal through certified offsite facilities in adherence to waste management regulations
- Periodic waste audits to track compliance, identify improvements and inform site-level action plans
- Defined targets for waste reduction and performance benchmarking across units
- Dedicated compliance function that monitors regulatory landscape and ensures adherence with evolving standards
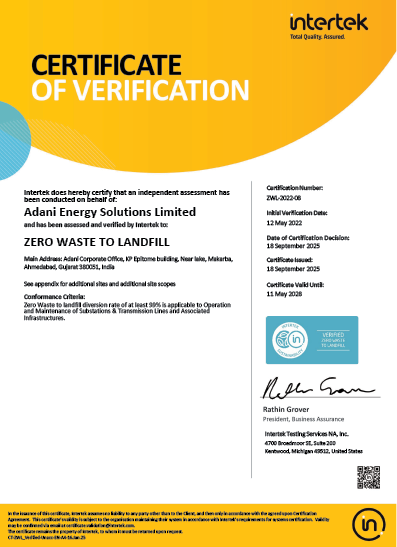
Certified Zero Landfill operations and externally assured waste data solidifies our commitment to circularity and compliance. In FY 2025-26, we demonstrated full legal and regulatory compliance with 100% responsible waste disposal.
Waste Data Management and Quality Assurance
Waste data is managed through a robust architecture that combines direct measurement, analytical modelling and trend analysis. All types of waste are identified and classified as hazardous and non-hazardous waste in line with MoEF&CC and CPCB regulations. Transfer notes from authorised contracted waste collectors capture waste type, quantity and treatment methods such as recycling or repurposing. Historical data analysis and predictive modelling provide insights into waste patterns and future requirements, supporting effective monitoring, and informed decisions and transparent disclosures. All records comply with CEA standards and regulatory requirements and regulatory norms, with data integrity validated through independent external assurance.
Value Chain Waste Management
Upstream Waste: Waste Generated during Procurement and Delivery of Equipment and Materials
| Source | Waste Type | Waste Management Process |
|---|---|---|
| Packaging waste from new AIS/GIS equipment | Non-Hazardous and Plastic Waste Packaging material such as paper, cardboard, plastic wrappings, wooden pallets |
|
| Raw material waste generated from switchgear / tower structures | Hazardous and non-hazardous Scrap metals (steel, aluminium, alloys), transformer oils, backup system batteries, maintenance chemicals, and packaging materials, office waste and industrial sludge from wastewater treatment | |
| Materials required for design and upgrades of electrical and electronic components | E-waste Electronic components and materials requiring specialised handling and disposal |
Operational Waste
| Source | Waste Type | Waste Management Process |
|---|---|---|
| Material required for design and upgrades of substations | E-Waste, Hazardous waste and Non-Hazardous waste
Construction and Demolition Waste: Concrete and masonry debris, metal scraps (steel, aluminium, copper), insulation materials (oils and gases), and outdated electrical cables and wires from dismantled AIS equipment. Packaging Waste: Generated during equipment delivery and installation, comprising cardboard, paper, plastic wrappings, and wooden pallets used for protection and handling. Hazardous Waste: Includes insulating oils and oil-soaked solid waste, which are managed through specialised disposal protocols. Electronic Waste: Arises from upgrades and replacements of control panels, circuit boards, sensors, and meters. |
|
Downstream Waste: Generated from the use of our Products and Services
| Source | Waste Type | Waste Management Process |
|---|---|---|
| Electricity Use | E-Waste
|
|
| Smart Meter Use | Non-Hazardous & E-Waste Packaging waste and faulty meters, if any |
|
100% Zero Waste to Landfill
certified sites, including the Head Office, grid division sites and Retail division operations
Resource Recovery and Circular Outcomes
E-Waste Stewardship
- A comprehensive asset management programme to track electronic devices across their lifecycles
- Partnership with certified e-waste recyclers for safe recovery, preventing environmental harm
- 366.23 MT of e-waste diverted from landfills highlighting circular material flows
Circular Solutions for Packaging Waste
- Shift from single use to reusable packaging for transport and storage of components
- Implemented recycling programmes and partnered with local recyclers for circular handling of packaging waste such as cardboard, plastic, and foam
General Waste Management and Compliance
- Extensive waste segregation and recycling programmes to manage everyday waste
- Training and awareness programmes to educate employees on waste segregation at source, for proper disposal and recycling
- Introduced recycling programmes to reward employee’s efforts in waste reduction
Smart Metering and Sustainability
- Large scale smart meters rollout replaces traditional meters with digital ones
- Smart meters provide consumers with real-time energy usage data, enabling them to optimise their energy consumption
- Longer asset life of digital meters reduces cuts waste
- Automated meter readings eliminate physical visits, leading to operational efficiencies and lesser environmental impact
- Enhanced monitoring enables utilities to promptly detect and address energy thefts and system losses, improving overall efficiency
Resource Efficiency in FY 2025-26
Key Material Consumption
| Particulars | Unit | FY 2021-22 | FY 2022-23 | FY 2023-24 | FY 2024-25 | FY 2025-26 |
|---|---|---|---|---|---|---|
| Coal | MT | 19,88,929 | 22,22,916 | 21,54,502 | 12,23,840* | 0 |
| Reinforced cement concrete (RCC) | Cum | 1,34,853 | 70,612 | 1,38,637 | 1,37,725 | 51,036 |
| Steel (tower part) | MT | 29,303 | 29,266 | 1,01,523 | 73,202 | 15,582 |
| Aluminium alloy (conductor) | MT | 18,616 | 52,395 | 37,032 | 30,640 | 6,522 |
| Steel wires (conductor and earth wire) | MT | 2,559 | 2,072 | 646 | 647 | 666 |
| Diesel consumption | KL | 556.86 | 35,682 | 1,447 | 1,447 | 4,096 |
*A significant reduction in material consumption during FY 2024-25 is primarily attributed to the divestment of Adani Energy Solutions’ sole 500 MW Adani Dahanu Thermal Power Station, effective September 26, 2024. The data presented reflects only non-renewable material inputs.
Notably, 39% of the total steel input used in FY 2023-24 comprised recycled or reused steel. This figure is consistent with national trends, with the CRISIL Research Report (2022) indicating an average steel scrap content of 37% in India.
The Adani Energy Solutions operates in the transmission and distribution of electricity and does not manufacture or sell physical products or packaging materials subject to reclamation. Therefore, GRI 301-3 does not apply to us.
Waste Diverted from Disposal (in MT)
| Type of Waste | End-of-Life Method | FY 2021-22 | FY 2022-23 | FY 2023-24 | FY 2024-25 | FY 2025-26 |
|---|---|---|---|---|---|---|
| Hazardous | Recycled | 319.8 | 171.6 | 81.68 | 181.79 | 162.98 |
| Reused | 0 | 0 | 0 | 0.49 | 0 | |
| Other Recovery Options | 0 | 0 | 0 | 0 | 0 | |
| Total | 319.8 | 171.6 | 81.68 | 182.28 | 162.98 | |
| Non-Hazardous | Recycled | 3,295 | 2,645 | 3,118.6 | 3,578.85 | 3,337.25 |
| Reused | 0.3 | 18.8 | 0 | 6.8 | 790.00 | |
| Other Recovery Options | 0 | 11.9 | 0 | 2.89 | 0 | |
| Total | 3,295.3 | 2,675.7 | 2,509.13 | 3,588.54 | 4,127.25 |
0.00%
Total hazardous waste diverted from disposal (onsite)
99.85%
Total hazardous waste diverted from disposal (offsite)
19.14%
Total non-hazardous waste diverted from disposal (onsite)
80.85%
Total non-hazardous waste diverted from disposal (offsite)
Waste Directed to Disposal (in MT)
| Type of Waste | End-of-Life Method | FY 2021-22 | FY 2022-23 | FY 2023-24 | FY 2024-25 | FY 2025-26 |
|---|---|---|---|---|---|---|
| Hazardous | Landfilling | 0 | 0 | 14.925 | 5.35 | 2.55 |
| Incineration (with energy recovery) | 7.0 | 20.0 | 4.15 | 2.96 | 5.02 | |
| Incineration (without energy recovery) | 0 | 0 | 0 | 0 | 0 | |
| Other and unknown Disposal Options | 0 | 0 | 0 | 0 | 0 | |
| Total | 7.0 | 20.0 | 19.07 | 8.31 | 7.57 | |
| Non-Hazardous | Landfilling | 23.3 | 22.0 | 6.62 | 7.35 | 0.53 |
| Incineration (with energy recovery) | 0 | 0 | 0 | 5.32 | 0 | |
| Incineration (without energy recovery) | 0 | 0 | 0 | 0 | 0 | |
| Other and unknown Disposal Options | 0 | 11.9 | 0 | 0 | 0 | |
| Total | 23.3 | 22.0 | 6.617 | 12.67 | 0.53 |
Zero
Total hazardous and non-hazardous waste directed to disposal (onsite)
0.15%
Total hazardous waste directed to disposal (offsite)
0.01%
Total non-hazardous waste directed to disposal (offsite)
Note: ‘Onsite’ means within the physical boundary or where Adani Energy Solutions has administrative control, and ‘Offsite’ means outside the physical boundary or administrative control of Adani Energy Solutions
Water is fundamental to both communities and business continuity. We manage our water footprint across all operational locations with careful monitoring of water withdrawal, consumption and discharge, particularly in the water-stressed regions. Water-Related considerations are a part of our operational planning, risk management and sustainability strategy to ensure its availability today as well as in future.
100%
water recycled and reused for non-potable in-house operations
72.9%
Reduction in water consumption intensity per ₹ Revenue w.r.t. FY 2019-20
No Water-Related incidents
such as operational interruptions/plant closures and revenue loss in last five fiscal years
Identifying Water-Related Risks and Impacts
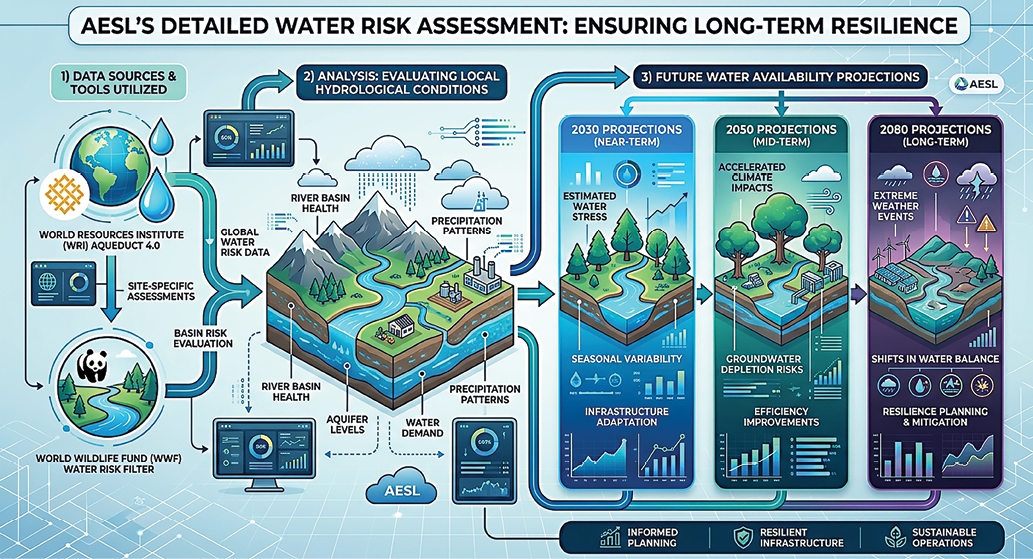
We proactively identify and manage Water-Related risks across all operational sites through continuous monitoring, regulatory vigilance and periodic assessments using global best practices, tools and climate science.
Climate Scenarios Considered:
- Business as usual: SSP 3 RCP 7.0
- Optimistic scenario: SSP 1 RCP 2.6
- Pessimistic: SSP 5 RCP 8.5
Science-Based Water Risk Assessment
In FY 2025-26, we conducted a detailed water risk assessment using the updated WRI Aqueduct 4.0 and WWF Water Risk Filter tools. These tools helped us evaluate local hydrological conditions and assess future water availability with projections developed for the time horizons 2030, 2050 and 2080. In addition, we also conducted climate scenario analysis aligned with the IPCC RCP 4.5 pathway (projected temperature rise of 1.7 – 3.2°C). The analysis considered potential changes monthly maximum temperatures, precipitation patterns, drought likelihood and flood exposure during 2020-2029 period. This enabled us to identify operations located in water-stressed regions, anticipate potential Water-Related conflicts and understand stakeholder groups likely to be impacted.
Key Risks Identified and Mitigation Strategy
| Water-Related Risks | Potential Impacts | Mitigation Strategy |
|---|---|---|
 Physical Risks Physical RisksLocation-Specific risks related to water quantity and quality |
|
|
 Regulatory Risks Regulatory RisksRisks arising from evolving water policies, regulatory changes and compliance requirements |
|
|
 Reputational Risks Reputational RisksRisks arising from ineffective water management and stakeholder concerns |
|
|
60% : 40%
water consumption in non-water stressed and water-stressed regions of 12 operational sites 11 sites has Rain water Harvesting system of 1,18,070 m3 capacity equivalent to (429%) against FY 2025-26 requirement of 27,505 m3.
Managing Water-Related Impacts
We manage water-related impacts across our operations and value chain through a disciplined, collaborative approach, partnering with environmental experts, local authorities, communities, suppliers and customers. Our interventions focus on reducing water consumption, increasing recycling & reuse and rainwater harvesting. Regular audits, employee trainings and value chain engagement drive accountability and shared accountability.
Zero Liquid Discharge and Effluent Management
We follow a Zero Liquid Discharge (ZLD) principle across our operations, maintaining stringent effluent quality standards in line with World Health Organization (WHO) and the United States Environmental Protection Agency (EPA) guidelines, and sectoral benchmarks. These standards cover key parameters, such as pH, BOD, COD, TSS, and hazardous substances. Where local discharge regulations are absent, we apply internal water quality standards. More than 100% of our sites fall under the white category industry, that primarily use water for domestic purposes. Yet we maintain strict internal water-use protocols.
Our discharge limits are tailored to the profile of receiving waterbodies, considering ecological status, flow and pollutant levels. For vulnerable environments, we implement enhanced treatment and stricter standards. For example, we strictly monitor in real time that sea water used for indirect condenser cooling at ADTPS must not exceed 4.5°C above ambient temperature, a limit tighter than the MPCB’s 5°C guideline. The internal standards are regularly reviewed and updated to stay relevant with evolving regulations and global best practices. There have been zero instances of incidents of non-compliance with discharge limits in FY 2025-26.
At ADTPS, Dahanu our supplier the sewage treatment plant operates well below the regulatory limits. Targets are set to not exceed 40% of the consent-to-operate thresholds. 100% of treated water and rejects are reused for onsite horticulture for circular resource management.
Key Highlights from our UpStream Value chain

Goal Setting and Public Policy Alignment
Our science-based water efficiency targets align with public policies and are informed through collaborative, multi-stakeholder engagement process. The targets are shaped by predictive modelling of climate data and consider the local water stress conditions to ensure operational efficiency for responsible usage. We actively collaborate with regulators and follow national and regional water conservation guidelines. Our water performance is assured by independent third-party to and is publicly disclosed to maintain credibility and transparency.

Water Security: Maintained ‘A-’ Leadership band
Recognising strong water stewardship, risk management and transparency in reporting
Change in Storage Capacity (used particularly for fire safety)

Building Long-Term Water Resilience
We use the insights from WRI Aqueduct 4.0 to strengthen our water storage and resilience measures, particularly in water-stressed areas. This ensures business continuity during periods of drought and water scarcity. We maintain Zero Discharge across all sites which covers both freshwater (freshwater ≤1,000 mg/L Total Dissolved Solids) and water discharge by other sources (>1,000 mg/L Total Dissolved Solids). Efficiency practices such as water reuse and zero discharge help us balance long-term operational resilience with ecological sustainability.
Our Rainwater Harvesting Framework
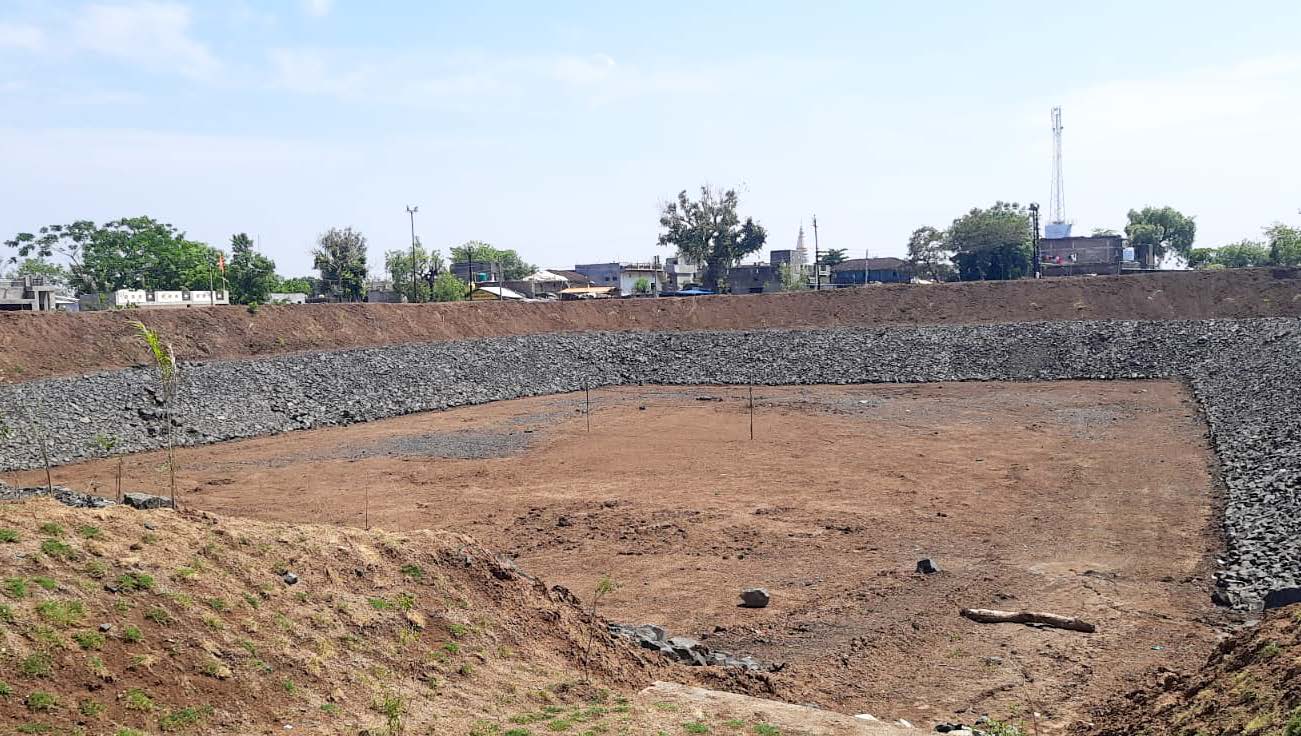
Adani Energy Solutions has deployed rainwater harvesting model across the facilities and in the adjacent areas of operations as a major water conservation measure. Activities beyond direct operational control are supported through the CSR funding, viewed as a long-term investment for ecosystem resilience. There is a dedicated maintenance team, which receives regular training for the upkeep of the systems. Public awareness workshops, seminars and campaigns further strengthened the objective behind the initiative.
81%
Operational Sites have Rainwater Harvesting Systems with capacity ~398 Mega Litres
Key Interventions Include:
- Rooftop Harvesting: To collect and filter rainwater from building rooftops for reuse
- Surface Runoff Harvesting: Underground recharge pits and percolation tanks to replenish groundwater
- Rain Gardens: Green zones around our facilities, improving aesthetics along with groundwater recharge
Disciplined Implementation
- Phase 1: Conducted site surveys, analysed rainfall patterns, and identified suitable locations considering the specific needs and constraints of each site
- Phase 2: Installed rooftop collection systems, recharge pits and rain gardens, using advanced materials and technology for durability and efficiency
- Phase 3: Established monitoring and maintenance plans, including regular inspections, cleaning of filters, and storage tanks upkeep. A third-party was appointed for annual due diligence to ensure sustained impact on the stakeholders and communities
Value Created
- Reduced dependence on external water sources
- Improved groundwater levels, particularly in stressed areas
- Cost savings through water reuse in non-potable operations
- Lower flood risks or lesser strain on local water bodies
- Enhanced green cover and local ecology
Water Performance in FY 2025-26
Water Consumption and Discharge
| Particulars | FY 2021-22 | FY 2022-23 | FY 2023-24 | FY 2024-25 | FY 2025-26 | |||||
|---|---|---|---|---|---|---|---|---|---|---|
| From all Areas | From Water Stressed Areas | From all Areas | From Water Stressed Areas | From all Areas | From Water Stressed Areas | From all Areas | From Water Stressed Areas | From all Areas | From Water Stressed Areas | |
| Water Withdrawal | ||||||||||
| Surface Water (≤1,000 mg/L Total Dissolved Solids) | 15,76,876 | 30 | 17,76,885 | 0 | 21,12,006 | 0 | 9,48,202 | 1,807 | 14,666 | 883 |
| Groundwater (≤1,000 mg/L Total Dissolved Solids) | 57,693 | 16,620 | 57,693 | 26,032 | 76,072 | 32,887 | 71,479 | 50,182 | 52,776 | 26,623 |
| Third-party Water (≤1,000 mg/L Total Dissolved Solids)* | 32,518 | 550 | 661 | 96 | 2,364 | 0 | 1,116 | 0 | 908 | 0 |
| Seawater/Desalinated Water (>1,000 mg/L Total Dissolved Solids) | 46,54,95,317 | 0 | 48,81,05,573 | 0 | 47,40,26,459 | 0 | 25,64,75,642 | 0 | 0 | 0 |
| Others (≤1,000 mg/L Total Dissolved Solids) | 1,47,898 | 1,928 | 7,731 | 726 | 7,169 | 0 | 8,537 | 0 | 729 | 0 |
| Total Water Withdrawal from all Sources (in kL) | 46,73,10,302 | 19,128 | 48,99,48,543 | 26,854 | 47,62,24,070 | 32,887 | 25,75,04,977 | 51,989 | 69,078 | 28,799 |
| Water Discharge (in kL) | 46,54,95,317 | 0 | 48,81,05,573 | 0 | 47,40,26,459 | 0 | 25,64,75,642 | 0 | 11,093 | 0 |
| Water Consumption (in kL) | 18,14,985 | 19,128 | 18,42,970 | 26,854 | 21,97,611 | 32,887 | 10,29,335 | 51,989 | 67,731 | 27,505 |
Notes:
- *Third-party water is withdrawn through surface water sources.
- Other water (>1,000 mg/L Total Dissolved Solids) withdrawal from all sources has been zero for all the years reported above, including FY 2025-26
- The decrease in Water Consumption and Water Consumption at water-stress areas at Adani Energy Solutions can be primarily attributed to the divestment of the Adani Dahanu Thermal Power Station (ADTPS), effective from September 26, 2024
- Discharge to surface water, groundwater, third-party water or any other water except seawater in all areas including water stressed areas have been zero. This includes both freshwater (=1,000 mg/L Total Dissolved Solids) and Water discharge by other water (>1,000 mg/L Total Dissolved Solids).
- Difference between Withdrawal and consumption = Water stored for future use.
Fresh Water Efficiency
(kL/revenue in Mn ₹)

Our Biodiversity Lens
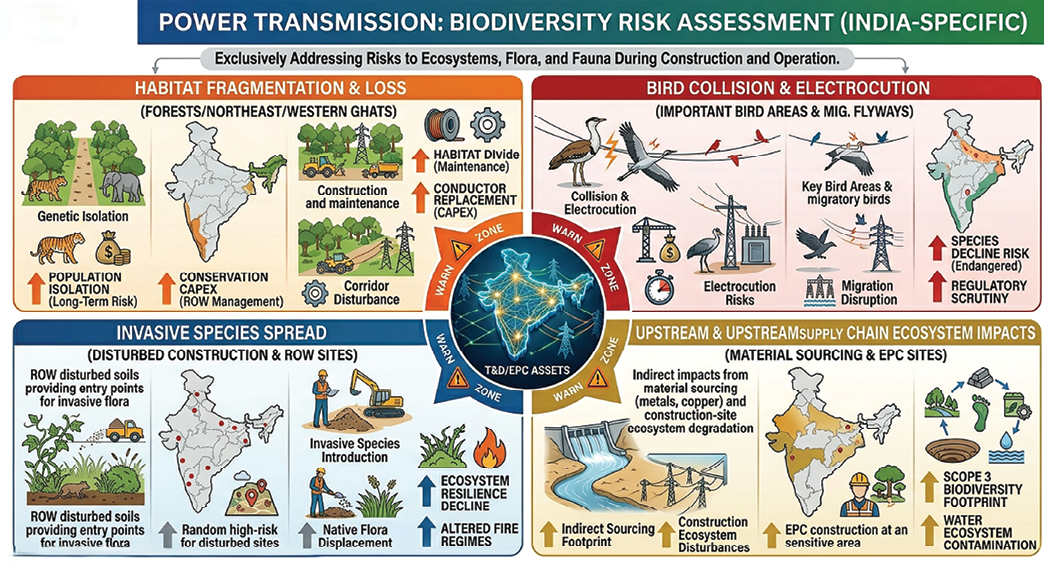
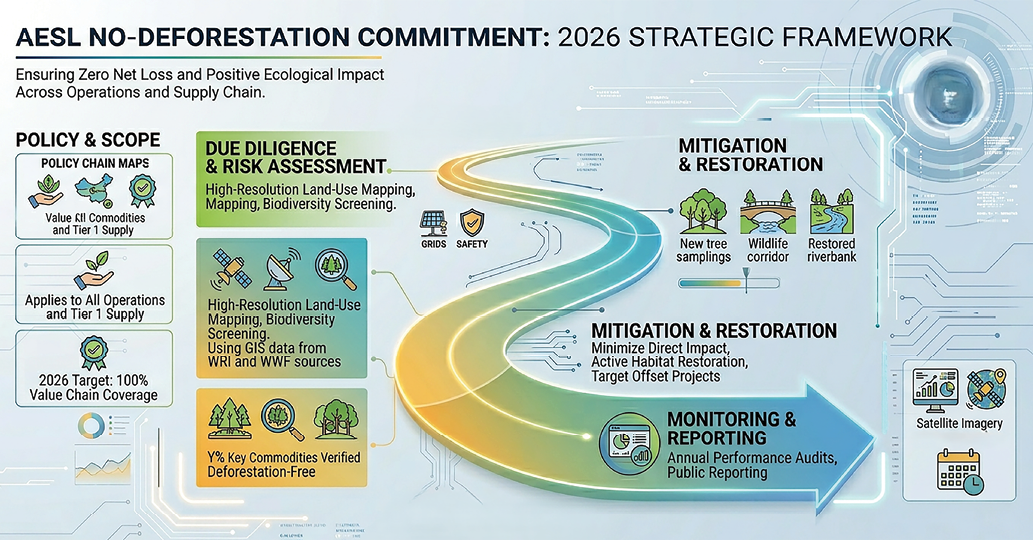
At Adani Energy Solutions, we view biodiversity as vital to long-term business sustainability and societal wellbeing. Our biodiversity measures embed nature positive thinking across infrastructure development, guided by a biodiversity policy aligned with the India Business & Biodiversity Initiative (IBBI 2.0). Biodiversity considerations are a part of our strategic planning, business decisions, project design and operational decision-making. We apply a mitigation hierarchy centred around avoidance, minimisation, restoration and offsetting informs our transmission route planning, site selection and land use decisions. Wherever feasible, we avoid biodiversity sensitive areas and align our practices with globally recognised biodiversity frameworks.
Commitment to IBBI Principles
Adani Energy Solutions has been a signatory to the India Business and Biodiversity Initiative (IBBI) since July 2020. The Company endorsed IBBI 2.0 declaration, reaffirming its commitment to No Net Loss of Biodiversity and aspiring to achieve Net Positive outcomes for all new projects by FY 2029-30.
We have set aspirational targets for biodiversity enhancement and habitat restoration, and are on track to achieve them in alignment with IBBI Principles 2.0
From No Net Loss to Net Positive Outcomes
We are committed to achieving No Net Loss (NNL) of biodiversity and progressing towards Net Positive Gain (NPG). We deliver this commitment through native species restoration, green corridor development and habitat enhancement in collaboration with conservation experts, local communities and relevant institutions. Continuous monitoring, adaptive management and employee training ensure ecological integrity, course correction, and minimise ecosystem disturbance.
Managing Ecosystem-Related Risks and Dependencies
We adopt a structured approach to identify, assess and manage nature-related risks and dependencies across our value chain. Biodiversity risks are systematically integrated within our enterprise risk management processes and embedded in strategic and operational decisions.
The biodiversity assessments cover:
We use globally recognised tools such as WWF’s Biodiversity Risk Filter and ENCORE, complemented by desk-based research, site-specific surveys, stakeholder consultations, remote sensing and GIS technology to evaluate both dependency-related and impact-related risks.
Biodiversity Impact Assessment and Management
We undertake detailed Environmental Impact Assessments (EIAs) for all new projects and significant operational changes, assessing potential biodiversity impacts through habitat and species monitoring. Insights from engagement and consultation with the local communities, NGOs, academic institutions, environmental experts, and government agencies, inform our Biodiversity Management Plans and habitat restoration projects to achieve positive ecological outcomes.
100%
of new and operational sites are covered under Biodiversity Impact Assessments.
No significant
biodiversity-related impacts were identified during FY 2025-26.
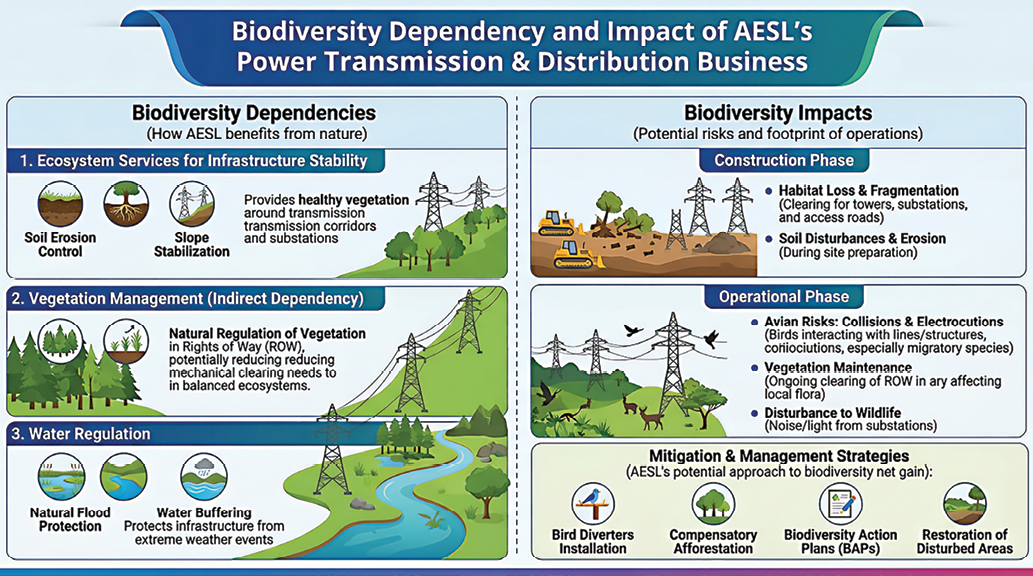
Biodiversity Risk and Impact Review
Our operational activities did not cause any significant negative impact on the species listed under the IUCN Red List or the national conservation lists at our operating locations. Nevertheless, certain near threatened, threatened and Schedule 1 species have been recorded in and around our sites. These include:

Scientific Name: Ephippiorhynchus asiaticus

Scientific Name: Anhinga rufa

Scientific Name: Threskiornis melanocephalus

Scientific Name: Limosa limosa

Scientific Name: Numenius Arquata

Scientific Name: Esacus recurvirostris

Scientific Name: Mycteria leucocephala
Ecosystem Service Matrix
About 37% of the Company’s total network comprises overhead lines that pass through diverse terrains comprising well-irrigated agricultural fields with low-growing crops and does not have any dry vegetation.
In the forest regions, transmission and distribution lines are routed only after securing all statutory permissions to ensure compliance with clearance requirements and minimise impact on forest ecosystems.
Expanding Green Cover and Ecological Connectivity
We actively invest in reforestation and green cover enhancement around our operational footprint to promote ecological restoration and carbon sequestration across forests, grasslands and mangroves.
Progress to Date:

* 851 Ha Reduced due to the Divestment of Adani Dahanu Thermal Power Station (ADTPS) w.e.f. September 26, 2024.
Responsible Land Use
The Land Acquisition, Rehabilitation and Resettlement Act (LARR), 2013 and its subsequent amendments do not mandate Social Impact Assessment for the transmission business (including substations). Our transmission lines do not involve physical displacement, and therefore rehabilitation and resettlement are not applicable. The Adani Energy Solutions adopts a right-of-way approach to minimise land acquisition and community displacement. We rely on compact gas-insulated substations instead of air-insulated substations which offer lower space requirements with greater reliability.
In case of new transmission lines, alternative transmission routes are carefully evaluated to avoid tree cutting. Where avoidance is not feasible, we ensure full statutory compliance, which also includes payment of compensatory afforestation charges.